
Did performance problems happen overnight, or did they sneak up on you? Any clue what caused the performance problems (e.g. loading 20K users into .LRN)
Is the filesystem out of space? Is the machine swapping to disk constantly?
-
Isolating and solving database problems.
Without daily internal maintenance, most databases slowly degrade in performance. For PostgreSQL, see the section called “Vacuum Postgres nightly”. For Oracle, use
exec dbms_stats.gather_schema_stats('SCHEMA_NAME')(Andrew Piskorski's Oracle notes).-
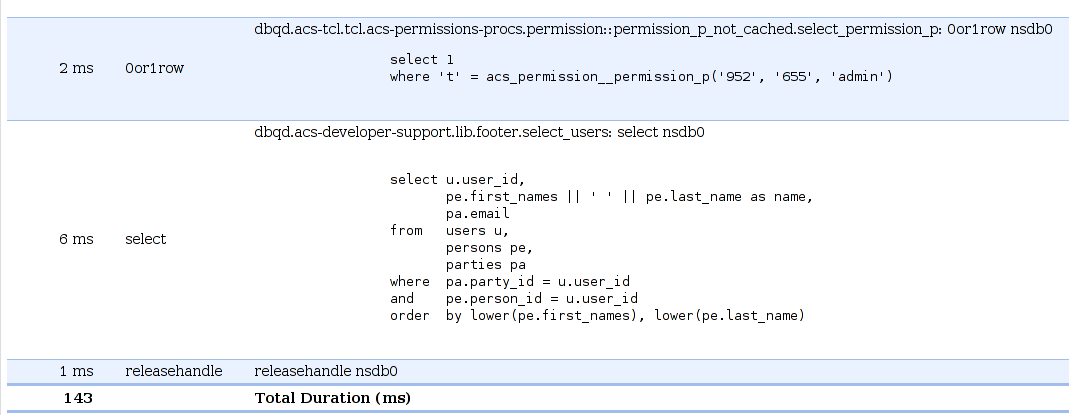
You can track the exact amount of time each database query on a page takes:
Go to Main Site : Site-Wide Administration : Install Software
Click on "Install New Application" in "Install from OpenACS Repository"
Choose "ACS Developer Support">
After install is complete, restart the server.
Browse to Developer Support, which is automatically mounted at
/ds.Turn on Database statistics
Browse directly to a slow page and click "Request Information" at the bottom of the page.
-
This should return a list of database queries on the page, including the exact query (so it can be cut-paste into psql or oracle) and the time each query took.
-
Identify a runaway Oracle query: first, use
ps auxortopto get the UNIX process ID of a runaway Oracle process.Log in to SQL*Plus as the admin:
[$OPENACS_SERVICE_NAME ~]$ svrmgrl Oracle Server Manager Release 3.1.7.0.0 - Production Copyright (c) 1997, 1999, Oracle Corporation. All Rights Reserved. Oracle8i Enterprise Edition Release 8.1.7.3.0 - Production With the Partitioning option JServer Release 8.1.7.3.0 - Production SVRMGR>
connect internalPassword:See all of the running queries, and match the UNIX PID:
select p.spid  -- The UNIX PID
       ,s.sid  ,s.serial#
       ,p.username  as os_user
       ,s.username  ,s.status
       ,p.terminal  ,p.program
  from v$session s  ,v$process p
 where p.addr = s.paddr
 order by s.username ,p.spid ,s.sid ,s.serial# ;
See the SQL behind the oracle processes:
select s.username
       ,s.sid  ,s.serial#
       ,sql.sql_text
  from v$session s, v$sqltext sql
 where sql.address    = s.sql_address
   and sql.hash_value = s.sql_hash_value
 --and upper(s.username) like 'USERNAME%'
 order by s.username ,s.sid ,s.serial# ,sql.piece ;
To kill a troubled process:
alter system kill session 'SID,SERIAL#'; --substitute values for SID and SERIAL#
-
Identify a runaway Postgres query. First, logging must be enabled in the database. This imposes a performance penalty and should not be done in normal operation.
Edit the file
postgresql.conf- its location depends on the PostgreSQL installation - and change#stats_command_string = false
to
stats_command_string = true
Next, connect to postgres (
psql
service0
) andselect * from pg_stat_activity;. Typical output should look like:datid | datname | procpid | usesysid | usename | current_query ----------+-------------+---------+----------+---------+----------------- 64344418 | openacs.org | 14122 | 101 | nsadmin | <IDLE> 64344418 | openacs.org | 14123 | 101 | nsadmin | delete from acs_mail_lite_queue where message_id = '2478608'; 64344418 | openacs.org | 14124 | 101 | nsadmin | <IDLE> 64344418 | openacs.org | 14137 | 101 | nsadmin | <IDLE> 64344418 | openacs.org | 14139 | 101 | nsadmin | <IDLE> 64344418 | openacs.org | 14309 | 101 | nsadmin | <IDLE> 64344418 | openacs.org | 14311 | 101 | nsadmin | <IDLE> 64344418 | openacs.org | 14549 | 101 | nsadmin | <IDLE> (8 rows) openacs.org=>
The first task is to create an appropriate environment for finding out what is going on inside Oracle. Oracle provides Statspack, a package to monitor and save the state of the v$ performance views. These reports help finding severe problems by exposing summary data about the Oracle wait interface, executed queries. You'll find the installation instructions in $ORACLE_HOME/rdbms/admin/spdoc.txt. Follow the instructions carefully and take periodic snapshots, this way you'll be able to look at historical performance data.
Also turn on the timed_statistics in your init.ora file, so that Statspack reports (and all other Oracle reports) are timed, which makes them a lot more meaningful. The overhead of timing data is about 1% per Oracle Support information.
To be able to get a overview of how Oracle executes a particular query, install "autotrace". I usually follow the instructions here http://asktom.oracle.com/~tkyte/article1/autotrace.html.
The Oracle Cost Based optimizer is a piece of software that tries to find the "optimal" execution plan for a given SQL statement. For that it estimates the costs of running a SQL query in a particular way (by default up to 80.000 permutations are being tested in a Oracle 8i). To get an adequate cost estimate, the CBO needs to have adequate statistics. For that Oracle supplies the dbms_stats package.