Forum OpenACS Development: Announcement: Boomerang Plugin for OpenACS
Boomerang is a JavaScript library to measure the performance of your website from your end user’s point of view. It has the ability to send performance data measured at the client back to the server via a beacon URL further analysis. The boomerang library implements Real User Measurement (RUM) to measure the performance experience of real users by collecting quality indicators from the clients.
The boomerang library is released under the BSD license.
Details:
https://soasta.github.io/boomerang/doc/
This package integrates boomerang with OpenACS, in particular with OpenACS subsites.
Features
- Obtain client site timings to measures the performance of your website from your end user's point of view.
- Support sampling (e.g. just obtain metrics from every nth request)
- Output performance data in a format suitable for feeding into Elasticsearch/Logstash (see below for example config files)
- Configure the appearance of the boomerang per subsite with the following parameters:
BoomerangEnabled 0|1 BoomerangSample 1 BoomerangBeaconUrl /boomerang_handler
The parameter BoomerangSample can be used for busy sites to sample not every request (when the value is 1), but e.g. every 5th request (setting BoomerangSample to 5). - Support for host-node-mapped subsites
- Site-wide admin support for compressing .js file
- Performance: include boomerang in the template costs about 0.3ms, processing of the beacon call takes about 1ms (filter times).
Installation
- Install this package via the OpenACS Package Manager
- Add this package to the templating system
- OpenACS 5.10.0d2 or newer:
The boomerang plugin uses the "subsite::page_plugin" callback, so no changes on templates are necessary. Make sure to update as well the acs-bootstrap-installer to 5.10.0d2 or newer to obtain the updated blank-master.
- OpenACS 5.9.1:
Add to the top of your blank-master.tcl the following snippet:if {[info commands ::boomerang::initialize_widget] ne ""} { ::boomerang::initialize_widget }
- OpenACS 5.10.0d2 or newer:
- Configure in the parameters of the subsite (e.g. the main subsite) the section "Boomerang Plugin"
Usage
For the explanation of the parameters, see:
https://soasta.github.io/boomerang/doc/howtos/howto-0.html
https://soasta.github.io/boomerang/doc/api/RT.html
https://soasta.github.io/boomerang/doc/api/navtiming.html
Prerequirements
The implementation uses nx from the next-scripting framework.
https://next-scripting.org/xowiki/
which is automatically installed for XOTcl2 via naviserver-openacs. It works best with OpenACS 5.10.0d2 or newer, but works as well with 5.9.1 (see INSTALLATION section above) or earlier versions with little adaptions
OPTIONAL: Define a custom Boomerang Plugin
- Clone boomerang repository
- Install npm, grunt if necessary
- Follow step 2 in https://github.com/SOASTA/boomerang which means
... configure plugins
... grunt clean build - The result is in the build directory. The generated files have the a build-time stamp in seconds included. You might which to rename these with a custom name.
- Copy the the *.min.js and *.min.js.gz files to the boomerang/www/resouces directory, which might be
cp build/boomerang-1.0.*.min.js build/boomerang-1.0.*.min.js.gz ..
and adapt the version number in the boomerang parameters (on /acs-subsite)
OPTIONAL: Feed Boomerang Data into an elasticsearch cluster
When boomerang is enabled, the results of the beacon are placed into
the OpenACS log directory with a name boomerang-*.log (containing the date).
Below are sample-snippets from OpenACS.org the log-files into elasticsearch ,
such that it can be analyzed later with kibana or grafana .
Example filebeat entry for the data feed:
      paths:
        - /var/www/openacs.org/log/boomerang-*.log
      input_type: log
      fields:
          log_type: boomerang-log
Example logststash entry (input filter for transforming the data from filebeat and to feed it into easticsearch)
  if [fields][log_type] == "boomerang-log" {
    json {
       source => "message"
       remove_field => [ "restiming" ]
    }
    grok {
       match => [ "source", "/var/www/%{GREEDYDATA:server}/log/boomerang-" ]
    }
    geoip { source => "clientip" }
  }
Example Analysis Screenshots from OpenACS
The following chart shows performance indicators of OpenACS.org over the last two days. The topmost chart is produced with grafana and shows elapsed time (left axis) and number of requests (right axis). "Average runtime" is the time measured on the server (how long does it take the server to fulfill the requests), whereas "Average t_done" is the time it took the browser to render the page (stating at the click). "t_done" is a default measurement provided by boomerang. Note, that the values from boomerang require that JavaScript is active at the client side (i.e. there are typically no spiders included in this value, as well only views).

We can see from these values that the average runtime is 36ms, while the full render time is on average 2.2s (about 60x larger). One reason is that static content is served quite fast. The second chart is as well produced with grafana and analyses the phases of requests based on W3C Navigation Timing . The nt_response_time shows the client point of view how long it took the server to provide an response to the request.

We can see that nt_response_time is about 100ms (it takes longer to server the dynamic html files). Also from this point of view the response time of the server for the main request only contributed a fraction of the total time. The longest time is the processing time in the client, which depends on the content, CSS, JavaScript, etc. Note that these are overall values, averaging over all requests. One can certainly drill down on certain pages for more details.
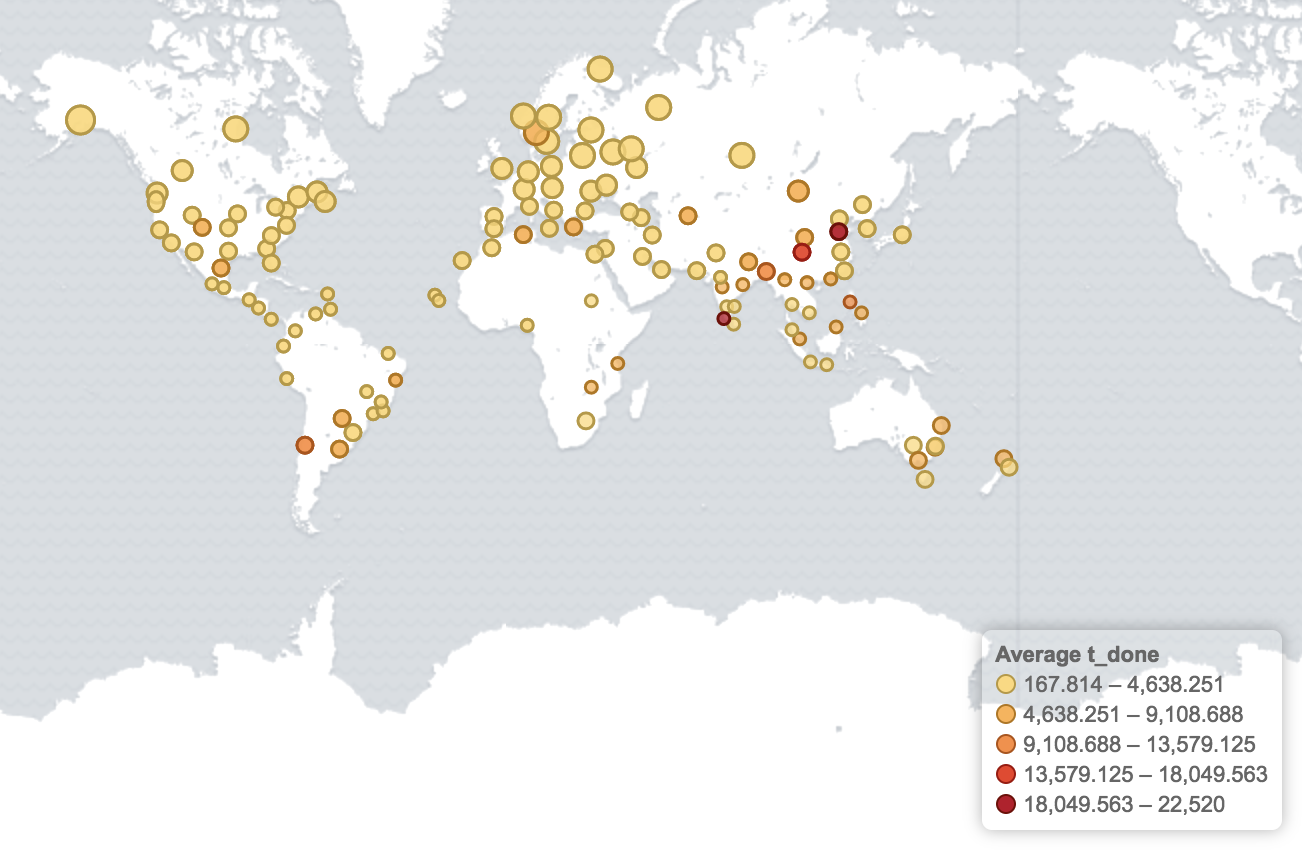
Another interesting aspect is the geographic location: has the client a good internet connection in respect to the server? The first map was produced with kibana and shows from which geographic locations pages of OpenACS.org were requested over the last week. Locations with more requests are shown emphasized.

We see that the highest number of requests are coming from the US (Seattle and Washington areas), and in Europe is Austria (Vienna) and France (Paris) issued many requests. If we analyze for boomerang requests with high values of "t_done", we see that these requests are coming from regions far away from Vienna, where the server is located (e.g. from Asia, South America, Australia)

