
Forum OpenACS Q&A: NaviServer stops serving connections when slow external api calls pile up.
We are calling a third party JIRA API to gather information for our users about certain JIRA tasks. These API requests happen each page refresh to keep the alert/information up-to-date as possible in their app header. This has worked well because 99.9 percent of the time this is a quick transaction usually much less than 500 ms. However, in rare cases (once a month or so) the JIRA API is slow for some reason and creates a slow runner situation
If enough of the threads get slow, then NaviServer stops serving connections. We have 48 cores on our VM so adding more cores I don't think will help.
What do you suggest to stop the issue from happening again?
I was thinking about creating another service in NodeJS that would do the API calls for us asynchronously and then write the results to a cache table. Another approach could be to utilize a cronjob to update the cache table every couple of minutes for those users that are active. But I was wondering what your suggested approach may be?
Thanks for your expertise, Marty ad_try {
set result [ns_http run -method GET -headers $request_headers -expire $timeout $url]
} trap NONE {result options} {
} trap CHILDSTATUS {result options} {
} on error {result options} {
} finally {
}
However, the 'expire $timeout' option does not seem to work in all situations and then the thread gets stuck waiting for the ns_http return
To add a little more information to this issue, the issue we are seeing is when the request to:
set timeout 500
set result [ns_http run -method GET -headers $request_headers -expire $timeout $url]
returns with a result that is trapped in the NONE case and contains result and error_info values of
:     status:
:     result: ssl connect failed: error:00000000:lib(0):func(0):reason(0)
:     error_info: ssl connect failed: error:00000000:lib(0):func(0):reason(0)
:        while executing
:    "ns_http run -method GET -headers $request_headers -expire $timeout $url"
:        ("::try" body line 4)
When this happens, the call to ns_http does not expire after the 500ms but can take anywhere from 20 seconds to 2 minutes to return.
The biggest questions we have are:
Why does ns_http not expire in these cases? And, is there a way to get it to so that a problem with the target site will not affect our site?
Thanks for any ideas you may have with this,
-Tony Kirkham
Please notice, that all time periods passed to NaviServer are in seconds if not specified differently. Calling
ns_http ... -expire 500 ...means "expire in 8 minutes and 20 seconds". To set an expiry of half a second, one can use e.g. one of the following formats:
ns_http ... -expire 500ms ...
ns_http ... -expire 0.5s ...
Note, that there are many possible causes to endanger the liveliness of a system when depending on external services (which might take "forever", or "hang" or which might terminate on service restarts, or which might have a high variance in performance, etc.).
When you configure the HTTP client log [1] (introduced with 4.99.21) and you use a recent version of the nsstats module (checkout Bitbucket), you can get the statistics about the ns_http requests, similar to the access.log. With this you can identify certain potential bottlenecks.
When the HTTP-requests needed by your application are slow or unreliable, throwing in more cores or memory does not help. However, you can use a separate connection pool for such requests, or you have to use some background processing (like e.g. with ns_jobs).
I am glad I asked the question. We were thinking the default was in ms for some time - thanks for taking the time and pointing that out.
Also, thank you for pointing out the HTTP client log configuration - I do want to set that up to help alert us to slowness in any external API calls.
Hope your holiday season has been a great one!
Sincerely,
Marty
Sorry about the confusion. When I typed in the set timeout 500 I inadvertently left off the ms. We are using 500ms as the value passed for the -expire argument.
With that information corrected our questions are still the same and any help you can give is greatly appreciated.
I have test cases where I set the -expire to 50ms and the expiration occurs as expected decoupling the target system from ours. The ssl error case is one that we cannot seem to manually reproduce and I am now wondering if the problem is rooted in the ssl connect failed problem. Is there a chance that the expiration timeout is not in affect while the ssl connection is being made? The symptoms we are seeing appear like the ssl connection has to be made before the timeout can cause a release of the call and return of control when the timeout is reached. Is this a possible issue and what can be done to fix it?
Thanks again for all of your help,
-Tony Kirkham
The documentation of ns_http says:
-expire T
time to wait for the whole request to complete. Upon expiry of this timer, request processing is unconditionally stopped, regardless of whether the connection or some data to read/write is still pending. The time can be specified in any supported ns_time format.
-timeout T
time to wait for connection setup and socket readable/writable state. The time can be specified in any supported ns_time format.
Thank you for your earlier responses. I have sifted through our earlier logs to gather more information to, hopefully, more precisely describe the issue we are seeing.
To restate: we are seeing issues where ns_http does not timeout and return after the specified expire value. We cannot seem to manually, intentionally reproduce the problem. When it happens, it seems that we are either having network issues or there is a problem with the target system but, we have not been able to identify these details during an incident. It is precisely these conditions under which we would want ns_http to be able to timeout and abandon the request, releasing the attempted connection to the target system, and returning to finish processing the current request to NaviServer.
Instead we experience ns_http not timing out with more and more requests stacking up and the system getting bogged down. The current fix when this occurs, since we have access, is to restart the target system. Once we do, NaviServer returns to its functioning state.
So, in short, the timeout works if all is well with the network and the target system. If the request just takes longer than desired, it will timeout. However, if there are "other problems", the timeout does not work.
After your last comment about the -expire and the -timeout arguments to ns_http, I have done a considerable amount of testing where I am able to verify that they both work as described in the documentation, under normal, functioning conditions.
In my case, I have found the successful threshold using -timeout 134ms and -expire 152ms. Shortening either of these values by 1 or 2 ms will normally cause the call to timeout. So I know that the timeout does work under normal conditions.
With all of that said, here are some log entries that show the problem as we experienced it during the last event. There are several requests to the target system shown. There are timings reported and the response from the call.
These are listed sequentially as they were logged. Any log entries that did not pertain to the call in question are replaced with ... (3 dots). The call to the target system is made inside a process that gathers and returns a bunch of information. The log includes a run_num: that is a unique, random string to identify the process run (this was added to try to debug this issue), a start run time: and end run time: which is the time from the start of the process to right before the call is made and right after the call returns, respectively, the call: being made, the error (if there was one), and the dur:, the duration of the call (which is the difference between the start and end times).
There are comments added before each process instance indicating if it was successful or not and whether the result was expected or not. This shows that the system went from timing-out correctly to "ignoring" the timeout and not returning for up to 30 seconds.
I will dissect the first instance in an attempt to explain the information provided and to set the pattern that the others follow.
######  -- Correct timeout
[04/Jan/2023:05:07:43][1.7fb883fff700][-conn:east_intra:default:19:4500-] Notice: pkg-notices: in_box_notices; run_num: 03A965C1; start run time: 1537 ms; call: wt::jira::notice::get_notice
The above, first entry, indicates that the response was Correct and did actually timeout appropriately. It shows the time in the process right before the call is made: start run time: 1537 ms; (::get_notice contains the call to ns_http)
[04/Jan/2023:05:07:44][1.7fb883fff700][-conn:east_intra:default:19:4500-] Error: The request to Jira expired after the specified length: 500ms, for user: user1;
:     status:
:     result: http request timeout
:     error_info: http request timeout
:        while executing
:    "ns_http run -method GET -headers $request_headers -expire $timeout $url"
:        ("::try" body line 4)
[04/Jan/2023:05:07:44][1.7fb883fff700][-conn:east_intra:default:19:4500-] Notice: The request to Jira for approval notices did not contain a group element. error message: {The request to Jira expired}
The above few lines show the result of the call. This call did in fact timeout and the response contained the result error information about the http request timing out.
[04/Jan/2023:05:07:44][1.7fb883fff700][-conn:east_intra:default:19:4500-] Notice: pkg-notices: in_box_notices; run_num: 03A965C1; end run time: 2071 ms; call: wt::jira::notice::get_notice; dur: 534 msThe above line shows the time right after the call which indicates the end run time: 2071 ms which then has a corresponding duration of dur: 534 ms. To make sure that this "end" entry corresponds with the above "start" entry, the run_num: 03A965C1 identifies these entries as belonging to the same "process instance". Yes, this is slightly longer than the 500 ms for the timeout but, there is the surrounding call and return that can account for that additional time.
The following are additional log excerpts showing subsequent calls with their entries following the same pattern as this one just explained.
######  -- Correct timeout
[04/Jan/2023:10:28:12][1.7fb8cfc7e700][-conn:east_intra:default:4:64408-] Notice: pkg-notices: in_box_notices; run_num: D9D43629; start run time: 1630 ms; call: wt::jira::notice::get_notice
...
[04/Jan/2023:10:28:12][1.7fb8cfc7e700][-conn:east_intra:default:4:64408-] Error: The request to Jira expired after the specified length: 500ms, for user: user2;
:     status:
:     result: http request timeout
:     error_info: http request timeout
:        while executing
:    "ns_http run -method GET -headers $request_headers -expire $timeout $url"
:        ("::try" body line 4)
[04/Jan/2023:10:28:12][1.7fb8cfc7e700][-conn:east_intra:default:4:64408-] Notice: The request to Jira for approval notices did not contain a group element. error message: {The request to Jira expired}
[04/Jan/2023:10:28:12][1.7fb8cfc7e700][-conn:east_intra:default:4:64408-] Notice: pkg-notices: in_box_notices; run_num: D9D43629; end   run time: 2162 ms; call: wt::jira::notice::get_notice; dur: 532 ms

######  -- Successful run NO timeout
[04/Jan/2023:13:18:42][1.7fb8cdc7a700][-conn:east_intra:default:8:108041-] Notice: pkg-notices: in_box_notices; run_num: DDF11C73; start run time: 1606 ms; call: wt::jira::notice::get_notice
...
[04/Jan/2023:13:18:42][1.7fb8cdc7a700][-conn:east_intra:default:8:108041-] Notice: pkg-notices: in_box_notices; run_num: DDF11C73; end   run time: 2034 ms; call: wt::jira::notice::get_notice; dur: 428 ms

######  -- Bad run, does not appear to timeout but has a duration of longer than 500 ms and no timeout  It is possible that the http call timed out but, something else got stuck or that it did not log the error response correctly. Wat!
[04/Jan/2023:13:18:51][1.7fb8a6ffd700][-conn:east_intra:default:21:108096-] Notice: pkg-notices: in_box_notices; run_num: 4F6A7C4C; start run time: 1708 ms; call: wt::jira::notice::get_notice
...
[04/Jan/2023:13:18:55][1.7fb8a6ffd700][-conn:east_intra:default:21:108096-] Notice: pkg-notices: in_box_notices; run_num: 4F6A7C4C; end   run time: 5552 ms; call: wt::jira::notice::get_notice; dur: 3844 ms {{no timeout?}}

######  -- Bad run timed out but long after the 500 ms
[04/Jan/2023:13:19:45][1.7fb8cec7c700][-conn:east_intra:default:5:108393-] Notice: pkg-notices: in_box_notices; run_num: 2C241021; start run time: 1562 ms; call: wt::jira::notice::get_notice
...
[04/Jan/2023:13:19:55][1.7fb8cec7c700][-conn:east_intra:default:5:108393-] Error: The request to Jira expired after the specified length: 500ms, for user: user3;
:     status:
:     result: http request timeout
:     error_info: http request timeout
:        while executing
:    "ns_http run -method GET -headers $request_headers -expire $timeout $url"
:        ("::try" body line 4)
[04/Jan/2023:13:19:55][1.7fb8cec7c700][-conn:east_intra:default:5:108393-] Notice: The request to Jira for approval notices did not contain a group element. error message: {The request to Jira expired}
[04/Jan/2023:13:19:55][1.7fb8cec7c700][-conn:east_intra:default:5:108393-] Notice: pkg-notices: in_box_notices; run_num: 2C241021; end   run time: 11185 ms; call: wt::jira::notice::get_notice; dur: 9623 ms

######  -- Bad run timed out but long after the 500 ms
[04/Jan/2023:13:19:49][1.7fb8cdc7a700][-conn:east_intra:default:8:108439-] Notice: pkg-notices: in_box_notices; run_num: D9370223; start run time: 1648 ms; call: wt::jira::notice::get_notice
...
[04/Jan/2023:13:20:02][1.7fb8cdc7a700][-conn:east_intra:default:8:108439-] Error: The request to Jira expired after the specified length: 500ms, for user: user4;
:     status:
:     result: http request timeout
:     error_info: http request timeout
:        while executing
:    "ns_http run -method GET -headers $request_headers -expire $timeout $url"
:        ("::try" body line 4)
[04/Jan/2023:13:20:02][1.7fb8cdc7a700][-conn:east_intra:default:8:108439-] Notice: The request to Jira for approval notices did not contain a group element. error message: {The request to Jira expired}
[04/Jan/2023:13:20:02][1.7fb8cdc7a700][-conn:east_intra:default:8:108439-] Notice: pkg-notices: in_box_notices; run_num: D9370223; end   run time: 13709 ms; call: wt::jira::notice::get_notice; dur: 12061 ms

###### -- SSL connect failed and does not timeout for 30 seconds!
[04/Jan/2023:13:19:52][1.7fb8a7fff700][-conn:east_intra:default:11:108445-] Notice: pkg-notices: in_box_notices; run_num: B881E1A9; start run time: 1675 ms; call: wt::jira::notice::get_notice
...
[04/Jan/2023:13:20:23][1.7fb8a7fff700][-conn:east_intra:default:11:108445-] Error: The request to Jira appeared to succeed but, the result variable did not contain an http status.  Additional info follows:
:     status:
:     result: ssl connect failed: error:00000000:lib(0):func(0):reason(0)
:     error_info: ssl connect failed: error:00000000:lib(0):func(0):reason(0)
:        while executing
:    "ns_http run -method GET -headers $request_headers -expire $timeout $url"
:        ("::try" body line 4)
[04/Jan/2023:13:20:23][1.7fb8a7fff700][-conn:east_intra:default:11:108445-] Notice: The request to Jira for approval notices did not contain a group element. error message: {The request to Jira appeared to succeed but,}
[04/Jan/2023:13:20:23][1.7fb8a7fff700][-conn:east_intra:default:11:108445-] Notice: pkg-notices: in_box_notices; run_num: B881E1A9; end   run time: 32666 ms; call: wt::jira::notice::get_notice; dur: 30991 ms

######  -- Super bad run no ssl error, timeout but appears to be stuck for 4 minutes!
[04/Jan/2023:13:21:29][1.7fb8a7fff700][-conn:east_intra:default:11:108951-] Notice: pkg-notices: in_box_notices; run_num: E5E4A969; start run time: 1639 ms; call: wt::jira::notice::get_notice
...
[04/Jan/2023:13:25:30][1.7fb8a7fff700][-conn:east_intra:default:11:108951-] Error: The request to Jira expired after the specified length: 500ms, for user: user5;
:     status:
:     result: http request timeout
:     error_info: http request timeout
:        while executing
:    "ns_http run -method GET -headers $request_headers -expire $timeout $url"
:        ("::try" body line 4)
[04/Jan/2023:13:25:30][1.7fb8a7fff700][-conn:east_intra:default:11:108951-] Notice: The request to Jira for approval notices did not contain a group element. error message: {The request to Jira expired}
[04/Jan/2023:13:25:30][1.7fb8a7fff700][-conn:east_intra:default:11:108951-] Notice: pkg-notices: in_box_notices; run_num: E5E4A969; end   run time: 242778 ms; call: wt::jira::notice::get_notice; dur: 241139 ms
This last excerpt is from a recent run and shows what happens if the url being requested does not exist. This is another data point to show the behavior of ns_http under different conditions in an attempt to reproduce the problems we are seeing. This, as can be seen, returns with the error even before the timeout is reached, which is what I would expect it to do.
###### -- Different time completely but checking if the url cannot be resolved: using a non-existing url
[19/Jan/2023:04:51:40][1.7f1524b09700][-conn:tkirkham_intrapg14a:default:4:4660-] Notice: pkg-notices: in_box_notices; run_num: BA7BA78D; start run time: 1757 ms; call: wt::jira::notice::get_notice
[19/Jan/2023:04:51:40][1.7f1524b09700][-conn:tkirkham_intrapg14a:default:4:4660-] Warning: SockConnect could not resolve host jirabad.com
[19/Jan/2023:04:51:40][1.7f1524b09700][-conn:tkirkham_intrapg14a:default:4:4660-] Error: The request to Jira appeared to succeed but, had additional info. (run_num: BA7BA78D) The result variable did not contain an http s
tatus.  The request took: 3 ms, for user: user1;. Additional info follows:
:     status:
:     result: can't connect to jirabad.com port 443: reason unknown
:     error_info: can't connect to jirabad.com port 443: reason unknown
:        while executing
:    "ns_http run -method GET -headers $request_headers -timeout $timeout -expire $expire_after $url"
:        ("::try" body line 5)
[19/Jan/2023:04:51:40][1.7f1524b09700][-conn:tkirkham_intrapg14a:default:4:4660-] Notice: The request to Jira for approval notices did not contain a group element. error message: {The request to Jira appeared to succeed but, had additional info.}
[19/Jan/2023:04:51:40][1.7f1524b09700][-conn:tkirkham_intrapg14a:default:4:4660-] Notice: pkg-notices: in_box_notices; run_num: BA7BA78D; end   run time: 1765 ms; call: wt::jira::notice::get_notice; dur: 8 ms
As it can be seen from these log entries, there are times when the ns_http call does not appear to honor the specified -timeout or -expire. It is getting stuck somewhere. We are setting up the http logging capability to see if we can see any additional information but, we will be waiting for another event to occur to be able to get any additional data.
Does this additional information give any new insight into what may be causing this and how to go about finding a solution?
Thank you very much for any help you can give.
-Tony
I found that I did have ns_http logging turned on back in Dec for our server. Here is the logging for that time period that Tony outlined above. Most of the http requests come back as "ok". However during the event it starts getting the "socktimeout".
Note: I did a regex to remove the http url from the logs below. which messed up some of the times below - but you can get the idea.
httpclient.log.2023-01-04:[04/Jan/2023:07:59:25 -0700] -conn:east_intra:default:8:15161- 408 GET  0.516420 250 0 socktimeout
httpclient.log.2023-01-04:[04/Jan/2023:10:28:12 -0700] -conn:east_intra:default:4:64408- 408 GET  0.515892 249 0 socktimeout
httpclient.log.2023-01-04:[04/Jan/2023:12:14:44 -0700] -conn:east_intra:default:23:94250- 408 GET 0.523803 251 0 socktimeout
httpclient.log.2023-01-04:[04/Jan/2023:13:18:59 -0700] -conn:east_intra:default:20:107724- 408 GET 5.176037 249 0 socktimeout
httpclient.log.2023-01-04:[04/Jan/2023:13:19:00 -0700] -conn:east_intra:default:7:107727- 408 GET  5.447116 253 0 socktimeout
httpclient.log.2023-01-04:[04/Jan/2023:13:19:00 -0700] -conn:east_intra:default:26:107723- 408 GET 2.935857 253 0 socktimeout
httpclient.log.2023-01-04:[04/Jan/2023:13:19:05 -0700] -conn:east_intra:default:11:107682- 408 GET 12.189319 248 0 socktimeout
httpclient.log.2023-01-04:[04/Jan/2023:13:19:06 -0700] -conn:east_intra:default:21:108142- 408 GET  6.088616 251 0 socktimeout
httpclient.log.2023-01-04:[04/Jan/2023:13:19:06 -0700] -conn:east_intra:default:20:107798- 408 GET  5.512879 249 0 socktimeout
httpclient.log.2023-01-04:[04/Jan/2023:13:19:09 -0700] -conn:east_intra:default:9:107711- 408 GET 13.536374 248 0 socktimeout
httpclient.log.2023-01-04:[04/Jan/2023:13:19:09 -0700] -conn:east_intra:default:22:107742- 408 GET 13.842994 255 0 socktimeout
httpclient.log.2023-01-04:[04/Jan/2023:13:19:11 -0700] -conn:east_intra:default:21:107724- 408 GET 13.824829 250 0 socktimeout
httpclient.log.2023-01-04:[04/Jan/2023:13:19:12 -0700] -conn:east_intra:default:16:107767- 408 GET 10.915305 248 0 socktimeout
httpclient.log.2023-01-04:[04/Jan/2023:13:19:19 -0700] -conn:east_intra:default:14:108222- 408 GET 4.486691 248 0 socktimeout
httpclient.log.2023-01-04:[04/Jan/2023:13:19:21 -0700] -conn:east_intra:default:21:107843- 408 GET 4.174570 255 0 socktimeout
httpclient.log.2023-01-04:[04/Jan/2023:13:19:24 -0700] -conn:east_intra:default:20:107849- 408 GET 5.711919 254 0 socktimeout
httpclient.log.2023-01-04:[04/Jan/2023:13:19:29 -0700] -conn:east_intra:default:9:107798- 408 GET 18.505596 248 0 socktimeout
httpclient.log.2023-01-04:[04/Jan/2023:13:19:31 -0700] -conn:east_intra:default:20:107811- 408 GET .594533 246 0 socktimeout
httpclient.log.2023-01-04:[04/Jan/2023:13:19:31 -0700] -conn:east_intra:default:3:108235- 408 GET  12.005677 249 0 socktimeout
httpclient.log.2023-01-04:[04/Jan/2023:13:19:36 -0700] -conn:east_intra:default:21:107817- 408 GET .813049 246 0 socktimeout
httpclient.log.2023-01-04:[04/Jan/2023:13:19:37 -0700] -conn:east_intra:default:12:107887- 408 GET .480140 246 0 socktimeout
httpclient.log.2023-01-04:[04/Jan/2023:13:19:38 -0700] -conn:east_intra:default:24:108241- 408 GET  16.130720 249 0 socktimeout
httpclient.log.2023-01-04:[04/Jan/2023:13:19:44 -0700] -conn:east_intra:default:24:107882- 408 GET  7.496380 249 0 socktimeout
httpclient.log.2023-01-04:[04/Jan/2023:13:19:47 -0700] -conn:east_intra:default:9:107879- 408 GET  13.379564 249 0 socktimeout
httpclient.log.2023-01-04:[04/Jan/2023:13:19:51 -0700] -conn:east_intra:default:23:107951- 408 GET 13.059755 250 0 socktimeout
httpclient.log.2023-01-04:[04/Jan/2023:13:19:55 -0700] -conn:east_intra:default:5:108393- 408 GET 9.607222 248 0 socktimeout
httpclient.log.2023-01-04:[04/Jan/2023:13:19:55 -0700] -conn:east_intra:default:3:108342- 408 GET 17.152646 248 0 socktimeout
httpclient.log.2023-01-04:[04/Jan/2023:13:20:00 -0700] -conn:east_intra:default:25:107940- 408 GET  20.807879 249 0 socktimeout
httpclient.log.2023-01-04:[04/Jan/2023:13:20:00 -0700] -conn:east_intra:default:24:108366- 408 GET 17.202711 248 0 socktimeout
httpclient.log.2023-01-04:[04/Jan/2023:13:20:02 -0700] -conn:east_intra:default:8:108439- 408 GET  12.045099 250 0 socktimeout
httpclient.log.2023-01-04:[04/Jan/2023:13:20:09 -0700] -conn:east_intra:default:21:107988- 408 GET .771498 246 0 socktimeout
httpclient.log.2023-01-04:[04/Jan/2023:13:20:12 -0700] -conn:east_intra:default:16:107960- 408 GET 28.780352 252 0 socktimeout
httpclient.log.2023-01-04:[04/Jan/2023:13:20:16 -0700] -conn:east_intra:default:9:108019- 408 GET .608686 246 0 socktimeout
httpclient.log.2023-01-04:[04/Jan/2023:13:20:18 -0700] -conn:east_intra:default:5:108013- 408 GET  29.717849 249 0 socktimeout
httpclient.log.2023-01-04:[04/Jan/2023:13:20:19 -0700] -conn:east_intra:default:22:108375- 408 GET .627587 246 0 socktimeout
httpclient.log.2023-01-04:[04/Jan/2023:13:20:22 -0700] -conn:east_intra:default:21:108368- 408 GET  38.641054 249 0 socktimeout
httpclient.log.2023-01-04:[04/Jan/2023:13:20:33 -0700] -conn:east_intra:default:25:108069- 408 GET  29.511077 252 0 socktimeout
httpclient.log.2023-01-04:[04/Jan/2023:13:20:34 -0700] -conn:east_intra:default:20:108054- 408 GET  32.279787 249 0 socktimeout
httpclient.log.2023-01-04:[04/Jan/2023:13:20:48 -0700] -conn:east_intra:default:10:108042- 408 GET 47.660435 248 0 socktimeout
httpclient.log.2023-01-04:[04/Jan/2023:13:20:49 -0700] -conn:east_intra:default:23:108216- 408 GET 20.117876 248 0 socktimeout
httpclient.log.2023-01-04:[04/Jan/2023:13:20:56 -0700] -conn:east_intra:default:12:108106- 408 GET  51.582438 249 0 socktimeout
httpclient.log.2023-01-04:[04/Jan/2023:13:21:02 -0700] -conn:east_intra:default:24:108509- 408 GET ll 54.876855 251 0 socktimeout
httpclient.log.2023-01-04:[04/Jan/2023:13:21:02 -0700] -conn:east_intra:default:11:108594- 408 GET 5.997642 247 0 socktimeout
httpclient.log.2023-01-04:[04/Jan/2023:13:21:03 -0700] -conn:east_intra:default:23:108617- 408 GET ll 31.469172 251 0 socktimeout
httpclient.log.2023-01-04:[04/Jan/2023:13:21:07 -0700] -conn:east_intra:default:12:108164- 408 GET 4.105097 247 0 socktimeout
httpclient.log.2023-01-04:[04/Jan/2023:13:21:11 -0700] -conn:east_intra:default:22:108182- 408 GET 54.628319 252 0 socktimeout
httpclient.log.2023-01-04:[04/Jan/2023:13:21:12 -0700] -conn:east_intra:default:24:108197- 408 GET 41.523339 251 0 socktimeout
httpclient.log.2023-01-04:[04/Jan/2023:13:21:15 -0700] -conn:east_intra:default:7:108134- 408 GET  63.527589 249 0 socktimeout
httpclient.log.2023-01-04:[04/Jan/2023:13:21:16 -0700] -conn:east_intra:default:22:108096- 408 GET 68.639036 248 0 socktimeout
httpclient.log.2023-01-04:[04/Jan/2023:13:21:17 -0700] -conn:east_intra:default:8:108566- 408 GET  61.372250 252 0 socktimeout
httpclient.log.2023-01-04:[04/Jan/2023:13:21:18 -0700] -conn:east_intra:default:21:108679- 408 GET 32.201131 248 0 socktimeout
httpclient.log.2023-01-04:[04/Jan/2023:13:21:18 -0700] -conn:east_intra:default:5:108399- 408 GET  15.971250 250 0 socktimeout
httpclient.log.2023-01-04:[04/Jan/2023:13:21:25 -0700] -conn:east_intra:default:0:108293- 408 GET  40.729020 252 0 socktimeout
httpclient.log.2023-01-04:[04/Jan/2023:13:21:31 -0700] -conn:east_intra:default:3:108574- 408 GET  71.655337 252 0 socktimeout
httpclient.log.2023-01-04:[04/Jan/2023:13:21:32 -0700] -conn:east_intra:default:10:108354- 408 GET  33.713728 249 0 socktimeout
httpclient.log.2023-01-04:[04/Jan/2023:13:21:34 -0700] -conn:east_intra:default:12:108494- 408 GET  20.906858 250 0 socktimeout
httpclient.log.2023-01-04:[04/Jan/2023:13:21:38 -0700] -conn:east_intra:default:15:108722- 408 GET  43.294395 252 0 socktimeout
httpclient.log.2023-01-04:[04/Jan/2023:13:21:38 -0700] -conn:east_intra:default:25:108176- 408 GET  84.210662 252 0 socktimeout
httpclient.log.2023-01-04:[04/Jan/2023:13:21:39 -0700] -conn:east_intra:default:10:108480- 408 GET  27.168518 252 0 socktimeout
httpclient.log.2023-01-04:[04/Jan/2023:13:21:42 -0700] -conn:east_intra:default:9:108398- 408 GET  40.380548 249 0 socktimeout
httpclient.log.2023-01-04:[04/Jan/2023:13:21:43 -0700] -conn:east_intra:default:14:108712- 408 GET 49.512944 251 0 socktimeout
httpclient.log.2023-01-04:[04/Jan/2023:13:21:50 -0700] -conn:east_intra:default:24:108818- 408 GET 46.539838 248 0 socktimeout
httpclient.log.2023-01-04:[04/Jan/2023:13:21:57 -0700] -conn:east_intra:default:22:108495- 408 GET 42.593141 252 0 socktimeout
httpclient.log.2023-01-04:[04/Jan/2023:13:21:57 -0700] -conn:east_intra:default:23:108497- 408 GET 41.145480 251 0 socktimeout
httpclient.log.2023-01-04:[04/Jan/2023:13:21:58 -0700] -conn:east_intra:default:23:108831- 408 GET 48.879973 248 0 socktimeout
httpclient.log.2023-01-04:[04/Jan/2023:13:22:10 -0700] -conn:east_intra:default:10:108962- 408 GET 40.243329 251 0 socktimeout
httpclient.log.2023-01-04:[04/Jan/2023:13:22:12 -0700] -conn:east_intra:default:26:108237- 408 GET 94.416399 250 0 socktimeout
httpclient.log.2023-01-04:[04/Jan/2023:13:22:13 -0700] -conn:east_intra:default:16:108637- 408 GET 96.920893 249 0 socktimeout
httpclient.log.2023-01-04:[04/Jan/2023:13:22:21 -0700] -conn:east_intra:default:20:108320- 408 GET 85.359651 249 0 socktimeout
httpclient.log.2023-01-04:[04/Jan/2023:13:22:23 -0700] -conn:east_intra:default:23:108468- 408 GET .879757 246 0 socktimeout
httpclient.log.2023-01-04:[04/Jan/2023:13:22:26 -0700] -conn:east_intra:default:4:108148- 408 GET 136.548118 248 0 socktimeout
httpclient.log.2023-01-04:[04/Jan/2023:13:22:28 -0700] -conn:east_intra:default:25:108748- 408 GET  91.016362 249 0 socktimeout
httpclient.log.2023-01-04:[04/Jan/2023:13:22:30 -0700] -conn:east_intra:default:10:108570- 408 GET 51.610157 248 0 socktimeout
httpclient.log.2023-01-04:[04/Jan/2023:13:22:31 -0700] -conn:east_intra:default:22:108684- 408 GET 104.262222 250 0 socktimeout
httpclient.log.2023-01-04:[04/Jan/2023:13:22:34 -0700] -conn:east_intra:default:7:108588- 408 GET 61.043157 248 0 socktimeout
httpclient.log.2023-01-04:[04/Jan/2023:13:22:35 -0700] -conn:east_intra:default:25:108620- 408 GET 9.627491 247 0 socktimeout
httpclient.log.2023-01-04:[04/Jan/2023:13:22:50 -0700] -conn:east_intra:default:21:108283- 408 GET 129.393863 248 0 socktimeout
httpclient.log.2023-01-04:[04/Jan/2023:13:22:52 -0700] -conn:east_intra:default:17:108483- 408 GET .695438 246 0 socktimeout
httpclient.log.2023-01-04:[04/Jan/2023:13:22:57 -0700] -conn:east_intra:default:15:108476- 408 GET 104.937973 248 0 socktimeout
httpclient.log.2023-01-04:[04/Jan/2023:13:22:57 -0700] -conn:east_intra:default:24:108192- 408 GET  155.326306 249 0 socktimeout
httpclient.log.2023-01-04:[04/Jan/2023:13:23:00 -0700] -conn:east_intra:default:25:108245- 408 GET 140.595940 248 0 socktimeout
httpclient.log.2023-01-04:[04/Jan/2023:13:23:01 -0700] -conn:east_intra:default:7:108894- 408 GET 98.622823 248 0 socktimeout
httpclient.log.2023-01-04:[04/Jan/2023:13:23:06 -0700] -conn:east_intra:default:12:108449- 408 GET 113.756762 252 0 socktimeout
httpclient.log.2023-01-04:[04/Jan/2023:13:23:07 -0700] -conn:east_intra:default:10:108605- 408 GET 85.351878 252 0 socktimeout
httpclient.log.2023-01-04:[04/Jan/2023:13:23:17 -0700] -conn:east_intra:default:20:108315- 408 GET 144.119350 250 0 socktimeout
httpclient.log.2023-01-04:[04/Jan/2023:13:23:23 -0700] -conn:east_intra:default:8:108900- 408 GET 118.756065 248 0 socktimeout
httpclient.log.2023-01-04:[04/Jan/2023:13:23:26 -0700] -conn:east_intra:default:24:109000- 408 GET  93.741198 249 0 socktimeout
httpclient.log.2023-01-04:[04/Jan/2023:13:23:32 -0700] -conn:east_intra:default:17:108920- 408 GET  125.925933 249 0 socktimeout
httpclient.log.2023-01-04:[04/Jan/2023:13:23:57 -0700] -conn:east_intra:default:6:108947- 408 GET  148.084816 249 0 socktimeout
httpclient.log.2023-01-04:[04/Jan/2023:13:23:57 -0700] -conn:east_intra:default:22:108722- 408 GET  84.442027 249 0 socktimeout
httpclient.log.2023-01-04:[04/Jan/2023:13:24:17 -0700] -conn:east_intra:default:12:108793- 408 GET 96.831810 247 0 socktimeout
httpclient.log.2023-01-04:[04/Jan/2023:13:24:18 -0700] -conn:east_intra:default:7:108624- 408 GET 127.742452 248 0 socktimeout
httpclient.log.2023-01-04:[04/Jan/2023:13:24:33 -0700] -conn:east_intra:default:0:108896- 408 GET  190.394527 250 0 socktimeout
httpclient.log.2023-01-04:[04/Jan/2023:13:24:36 -0700] -conn:east_intra:default:20:108904- 408 GET 68.217058 250 0 socktimeout
httpclient.log.2023-01-04:[04/Jan/2023:13:24:58 -0700] -conn:east_intra:default:7:109154- 408 GET  112.403944 250 0 socktimeout
httpclient.log.2023-01-04:[04/Jan/2023:13:25:03 -0700] -conn:east_intra:default:21:108888- 408 GET 223.144202 250 0 socktimeout
httpclient.log.2023-01-04:[04/Jan/2023:13:25:22 -0700] -conn:east_intra:default:5:108906- 408 GET ll 113.063017 251 0 socktimeout
httpclient.log.2023-01-04:[04/Jan/2023:13:25:28 -0700] -conn:east_intra:default:20:108688- 408 GET 275.639013 248 0 socktimeout
httpclient.log.2023-01-04:[04/Jan/2023:13:25:30 -0700] -conn:east_intra:default:11:108951- 408 GET  241.122625 249 0 socktimeout
httpclient.log.2023-01-04:[04/Jan/2023:13:25:35 -0700] -conn:east_intra:default:15:108990- 408 GET 1.578623 246 0 socktimeout
httpclient.log.2023-01-04:[04/Jan/2023:13:25:44 -0700] -conn:east_intra:default:4:108745- 408 GET  193.000682 251 0 socktimeout
httpclient.log.2023-01-04:[04/Jan/2023:13:25:45 -0700] -conn:east_intra:default:2:108625- 408 GET 214.418165 248 0 socktimeout
httpclient.log.2023-01-04:[04/Jan/2023:13:25:52 -0700] -conn:east_intra:default:16:109039- 408 GET 215.447435 248 0 socktimeout
httpclient.log.2023-01-04:[04/Jan/2023:13:26:01 -0700] -conn:east_intra:default:10:109017- 408 GET 229.008790 252 0 socktimeout
httpclient.log.2023-01-04:[04/Jan/2023:13:26:06 -0700] -conn:east_intra:default:22:109084- 408 GET 210.648680 251 0 socktimeout
httpclient.log.2023-01-04:[04/Jan/2023:13:26:06 -0700] -conn:east_intra:default:17:108812- 408 GET 92.325250 247 0 socktimeout
httpclient.log.2023-01-04:[04/Jan/2023:13:26:15 -0700] -conn:east_intra:default:1:108656- 408 GET ll 237.540276 251 0 socktimeout
httpclient.log.2023-01-04:[04/Jan/2023:13:26:15 -0700] -conn:east_intra:default:14:108999- 408 GET 8.837546 246 0 socktimeout
httpclient.log.2023-01-04:[04/Jan/2023:13:26:32 -0700] -conn:east_intra:default:23:109010- 408 GET 268.498041 248 0 socktimeout
httpclient.log.2023-01-04:[04/Jan/2023:13:26:32 -0700] -conn:east_intra:default:25:109052- 408 GET 242.216212 250 0 socktimeout
httpclient.log.2023-01-04:[04/Jan/2023:13:26:38 -0700] -conn:east_intra:default:3:108652- 408 GET  262.370330 250 0 socktimeout
httpclient.log.2023-01-04:[04/Jan/2023:13:26:38 -0700] -conn:east_intra:default:17:109241- 408 GET 180.513084 249 0 socktimeout
httpclient.log.2023-01-04:[04/Jan/2023:13:26:38 -0700] -conn:east_intra:default:11:108803- 408 GET 232.654345 251 0 socktimeout
httpclient.log.2023-01-04:[04/Jan/2023:13:26:47 -0700] -conn:east_intra:default:26:108634- 408 GET 272.833796 248 0 socktimeout
httpclient.log.2023-01-04:[04/Jan/2023:13:27:00 -0700] -conn:east_intra:default:2:108929- 408 GET  177.406432 251 0 socktimeout
httpclient.log.2023-01-04:[04/Jan/2023:13:27:03 -0700] -conn:east_intra:default:13:108499- 408 GET  346.466944 249 0 socktimeout
httpclient.log.2023-01-04:[04/Jan/2023:13:27:17 -0700] -conn:east_intra:default:24:108584- 408 GET  333.355091 250 0 socktimeout
httpclient.log.2023-01-04:[04/Jan/2023:13:27:19 -0700] -conn:east_intra:default:8:109187- 408 GET  232.863224 250 0 socktimeout
httpclient.log.2023-01-04:[04/Jan/2023:13:27:22 -0700] -conn:east_intra:default:16:108601- 408 GET 327.653788 251 0 socktimeout
httpclient.log.2023-01-04:[04/Jan/2023:13:27:35 -0700] -conn:east_intra:default:12:108859- 408 GET 250.567207 250 0 socktimeout
httpclient.log.2023-01-04:[04/Jan/2023:13:27:45 -0700] -conn:east_intra:default:24:108997- 408 GET 150.688727 248 0 socktimeout
httpclient.log.2023-01-04:[04/Jan/2023:13:27:50 -0700] -conn:east_intra:default:3:109288- 408 GET  242.134824 249 0 socktimeout
httpclient.log.2023-01-04:[04/Jan/2023:13:27:50 -0700] -conn:east_intra:default:0:109349- 408 GET 95.473548 247 0 socktimeout
httpclient.log.2023-01-04:[04/Jan/2023:13:28:02 -0700] -conn:east_intra:default:9:108939- 408 GET  393.432969 249 0 socktimeout
httpclient.log.2023-01-04:[04/Jan/2023:13:28:14 -0700] -conn:east_intra:default:10:108840- 408 GET 299.674053 251 0 socktimeout
httpclient.log.2023-01-04:[04/Jan/2023:13:28:22 -0700] -conn:east_intra:default:21:108909- 408 GET 273.450253 251 0 socktimeout
httpclient.log.2023-01-04:[04/Jan/2023:13:28:23 -0700] -conn:east_intra:default:21:109408- 408 GET 194.214872 251 0 socktimeout
httpclient.log.2023-01-04:[04/Jan/2023:13:29:32 -0700] -conn:east_intra:default:20:108923- 408 GET 326.817746 255 0 socktimeout
httpclient.log.2023-01-04:[04/Jan/2023:13:29:35 -0700] -conn:east_intra:default:25:108787- 408 GET 391.962625 251 0 socktimeout
httpclient.log.2023-01-04:[04/Jan/2023:13:29:45 -0700] -conn:east_intra:default:23:109644- 408 GET 185.965064 250 0 socktimeout
httpclient.log.2023-01-04:[04/Jan/2023:13:29:51 -0700] -conn:east_intra:default:16:109285- 408 GET 119.081582 250 0 socktimeout
httpclient.log.2023-01-04:[04/Jan/2023:13:30:15 -0700] -conn:east_intra:default:24:109250- 408 GET 175.806915 248 0 socktimeout
httpclient.log.2023-01-04:[04/Jan/2023:13:30:24 -0700] -conn:east_intra:default:13:109198- 408 GET 198.548704 249 0 socktimeout
httpclient.log.2023-01-04:[04/Jan/2023:13:30:27 -0700] -conn:east_intra:default:7:109111- 408 GET  244.077961 251 0 socktimeout
httpclient.log.2023-01-04:[04/Jan/2023:13:30:35 -0700] -conn:east_intra:default:22:109043- 408 GET 298.185716 248 0 socktimeout
httpclient.log.2023-01-04:[04/Jan/2023:13:30:35 -0700] -conn:east_intra:default:20:109439- 408 GET 305.304181 250 0 socktimeout
httpclient.log.2023-01-04:[04/Jan/2023:13:30:46 -0700] -conn:east_intra:default:7:108986- 408 GET  371.101892 250 0 socktimeout
httpclient.log.2023-01-04:[04/Jan/2023:13:30:46 -0700] -conn:east_intra:default:7:109406- 408 GET 340.158311 248 0 socktimeout
httpclient.log.2023-01-04:[04/Jan/2023:13:30:55 -0700] -conn:east_intra:default:25:109328- 408 GET 160.446742 255 0 socktimeout
httpclient.log.2023-01-04:[04/Jan/2023:13:30:55 -0700] -conn:east_intra:default:17:109380- 408 GET 181.742554 250 0 socktimeout
httpclient.log.2023-01-04:[04/Jan/2023:13:30:55 -0700] -conn:east_intra:default:21:109407- 408 GET 149.118398 252 0 socktimeout
httpclient.log.2023-01-04:[04/Jan/2023:13:30:59 -0700] -conn:east_intra:default:8:109720- 408 GET 210.920445 248 0 socktimeout
httpclient.log.2023-01-04:[04/Jan/2023:13:31:07 -0700] -conn:east_intra:default:3:109750- 408 GET 193.740127 248 0 socktimeout
httpclient.log.2023-01-04:[04/Jan/2023:13:31:14 -0700] -conn:east_intra:default:3:109116- 408 GET 289.665739 248 0 socktimeout
Hope this helps.
Thanks for your expertise.
MartyAfter finding out that we had turned on the http logging a while ago, I went through and pulled out all of the http_log entries that correspond to the error_log entries I posted earlier and have listed them here along side the error_log entries.
When comparing these entries note that the timing in the error_log is reported in milliseconds and the timing in the http_log is in seconds.
A couple of things of interest.
- Among the entries that Marty posted above, most of them show that the request did time out but, long after the specified expire time of
500ms. This isn't expected behavior, is it? - The requests that show as succeeding in the
error_logshow a status ofokin thehttp_log(even the one that took over 3 seconds, weird) and those that show a timeout in theerror_logshow asocktimeoutin thehttp_log. So the two logs seem to match well. - The request that errored-out with the ssl error did not have an entry in the
http_logwhich makes sense if it is expected that the log entry occurs after a request completes, whether or not it was successful.
######  -- Correct timeout
## error_log
[04/Jan/2023:05:07:44][1.7fb883fff700][-conn:east_intra:default:19:4500-] Notice: pkg-notices: in_box_notices; run_num: 03A965C1; end   run time: 2071 ms; call: wt::jira::notice::get_notice; dur: 534 ms
## http_log
[04/Jan/2023:05:07:44 -0700] -conn:east_intra:default:19:4500- 408 GET https://target.site.url 0.518629 250 0 socktimeout

######  -- Correct timeout
## error_log
[04/Jan/2023:10:28:12][1.7fb8cfc7e700][-conn:east_intra:default:4:64408-] Notice: pkg-notices: in_box_notices; run_num: D9D43629; end   run time: 2162 ms; call: wt::jira::notice::get_notice; dur: 532 ms
## http_log
[04/Jan/2023:10:28:12 -0700] -conn:east_intra:default:4:64408- 408 GET https://target.site.url 0.515892 249 0 socktimeout

######  -- Successful run NO timeout
## error_log
[04/Jan/2023:13:18:42][1.7fb8cdc7a700][-conn:east_intra:default:8:108041-] Notice: pkg-notices: in_box_notices; run_num: DDF11C73; end   run time: 2034 ms; call: wt::jira::notice::get_notice; dur: 428 ms
## http_log
[04/Jan/2023:13:18:42 -0700] -conn:east_intra:default:8:108041- 200 GET https://target.site.url 0.412023 255 1022 ok

######  -- Bad run, does not appear to timeout but has a duration of longer than 500 ms and no timeout  It is possible that the http call timed out but, something else got stuck. Wat!
## error_log
[04/Jan/2023:13:18:55][1.7fb8a6ffd700][-conn:east_intra:default:21:108096-] Notice: pkg-notices: in_box_notices; run_num: 4F6A7C4C; end   run time: 5552 ms; call: wt::jira::notice::get_notice; dur: 3844 ms {{no timeout?}}
## http_log
[04/Jan/2023:13:18:55 -0700] -conn:east_intra:default:21:108096- 200 GET https://target.site.url 3.828102 251 796 ok

######  -- Bad run timed out but long after the 500 ms
## error_log
[04/Jan/2023:13:19:55][1.7fb8cec7c700][-conn:east_intra:default:5:108393-] Notice: pkg-notices: in_box_notices; run_num: 2C241021; end   run time: 11185 ms; call: wt::jira::notice::get_notice; dur: 9623 ms
## http_log
[04/Jan/2023:13:19:55 -0700] -conn:east_intra:default:5:108393- 408 GET https://target.site.url 9.607222 248 0 socktimeout

######  -- Bad run timed out but long after the 500 ms
## error_log
[04/Jan/2023:13:20:02][1.7fb8cdc7a700][-conn:east_intra:default:8:108439-] Notice: pkg-notices: in_box_notices; run_num: D9370223; end   run time: 13709 ms; call: wt::jira::notice::get_notice; dur: 12061 ms
## http_log
[04/Jan/2023:13:20:02 -0700] -conn:east_intra:default:8:108439- 408 GET https://target.site.url 12.045099 250 0 socktimeout

###### -- SSL connect failed and does not timeout for 30 seconds!
## error_log
[04/Jan/2023:13:20:23][1.7fb8a7fff700][-conn:east_intra:default:11:108445-] Notice: pkg-notices: in_box_notices; run_num: B881E1A9; end   run time: 32666 ms; call: wt::jira::notice::get_notice; dur: 30991 ms
## http_log
-- no entry was found in the http log to match with this request

######  -- Super bad run no ssl error, timeout but appears to be stuck for 4 minutes!
## error_log
[04/Jan/2023:13:25:30][1.7fb8a7fff700][-conn:east_intra:default:11:108951-] Notice: pkg-notices: in_box_notices; run_num: E5E4A969; end   run time: 242778 ms; call: wt::jira::notice::get_notice; dur: 241139 ms
## http_log
[04/Jan/2023:13:25:30 -0700] -conn:east_intra:default:11:108951- 408 GET https://target.site.url 241.122625 249 0 socktimeout
Sorry, if it feels like we are bombarding this thread with a bunch of information. We are just hoping that something we are finding can help make sense of what we are experiencing.
As always, thanks for your great help,
-Tony
we will try to help. What I read from your posting:
- you have no reliable way to reproduce the problem (being able to reproduce the issue at our side would help significantly)
- Only some ns_http requests have "-timeout" specified
- are all requests over HTTPS?
- is there anything special about the jira service (running on a signe/multiple servers, restarts/reboots at the time when problems happen, ...)?
removed the http url from the logs below. which messed up some of the times belowI don't understand what "messed up" means here. If you do not want to reveal the URL on a public site, just replace it by "127.0.0.1". If there are very long URLs, this is also important for debugging. In the log above, there are just 408 status codes. Is this really all? I need as well the success cases to get a full picture, to see parallel requests, typical answer times, etc. Can you mail the log to me?
Do you have a monitoring of the VM running? It is interesting to see the VM-size, the memory statistics etc. There are cases, where the full VM hangs, where you cannot do anything from a single process point of view, when the full process does not get CPU at all. The example in https://openacs.org/forums/message-view?message_id=5539060 shows a case, where the full process is stopped for 6 seconds simply because of a fork() happening in a Tcl pipe-open command just depending on the memory size of the process. This blocked can be much larger depending on the circumstances, there can be many other factors influencing such cases (e.g., file-system, etc.). When the whole process is stopped by the kernel for, e.g., 10 seconds, setting a timeout of 1 second does have the desired effect. To identify such cases it is not sufficient to look at a single thread, but necessary to know what's happening in the other threads (if there is something happening) and maybe also, what's happening on the machine at this time.
What are your version numbers of
- OpenSSL
- NaviSever
all the best
-gn
Sorry for the confusion on the http log I posted. I was in a hurry and used a rather simple regex to remove the url from the log and in a few cases it truncated the time on the left of the decimal point on the time. So for example the following log entry obviously had it's time truncated because it is missing a digit to the left of the decimal point. (.695438)
httpclient.log.2023-01-04:[04/Jan/2023:13:22:52 -0700] -conn:east_intra:default:17:108483- 408 GET .695438 246 0 socktimeout
However, any times that have 2 or 3 digits to the left of the decimal point are accurate times. I guess, I figured this would be enough to show that we were going past the -expired time.
Also, the log entry times that Tony verified with his comparison between the http log and his debug statements in the error.log are accurate.
Looking back I really should have taken more time with that file. Sorry about that.
We can get you the full log with context times that returned "ok" and full length url. Also, I believe we still have some VM stats for that day at around the time of the event that we can get to you
Thanks for your expertise and patience. MartyI have sent you an email with the information you requested. If you need more information let us know.
Thank you!
Marty
here is a summary of the client-log you sent to me:
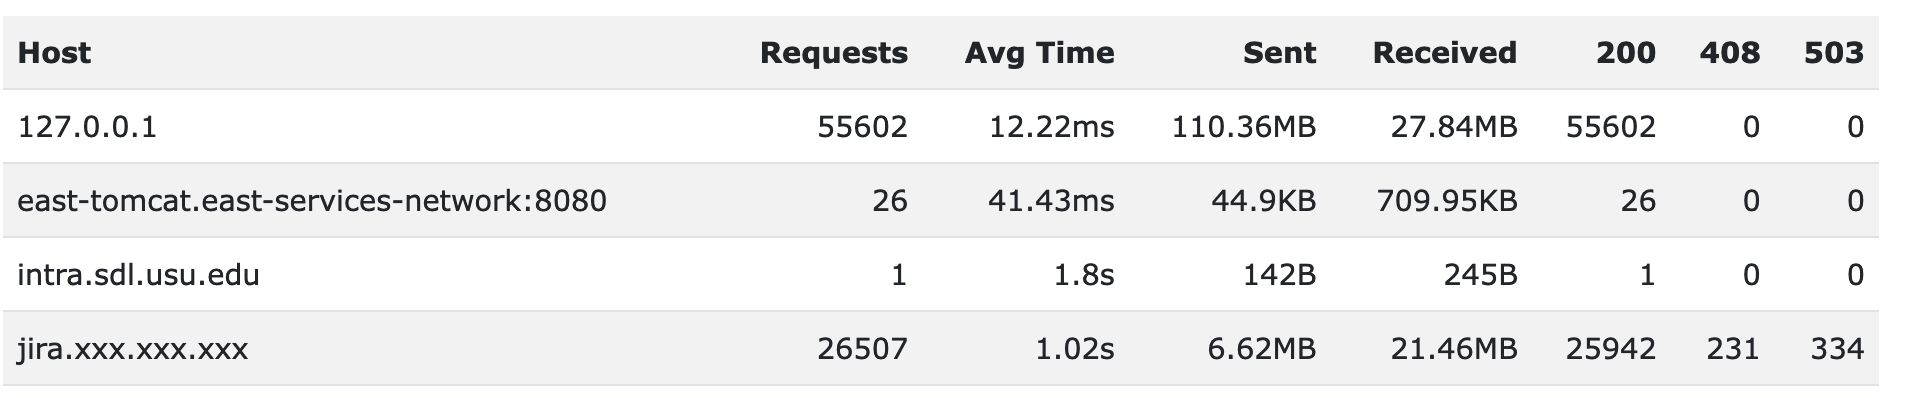
What i read from this is:
- there are a substantial number of requests sent to the servers,
- a high number of the requests are perfectly fine, during a certain time window, there were troubles.
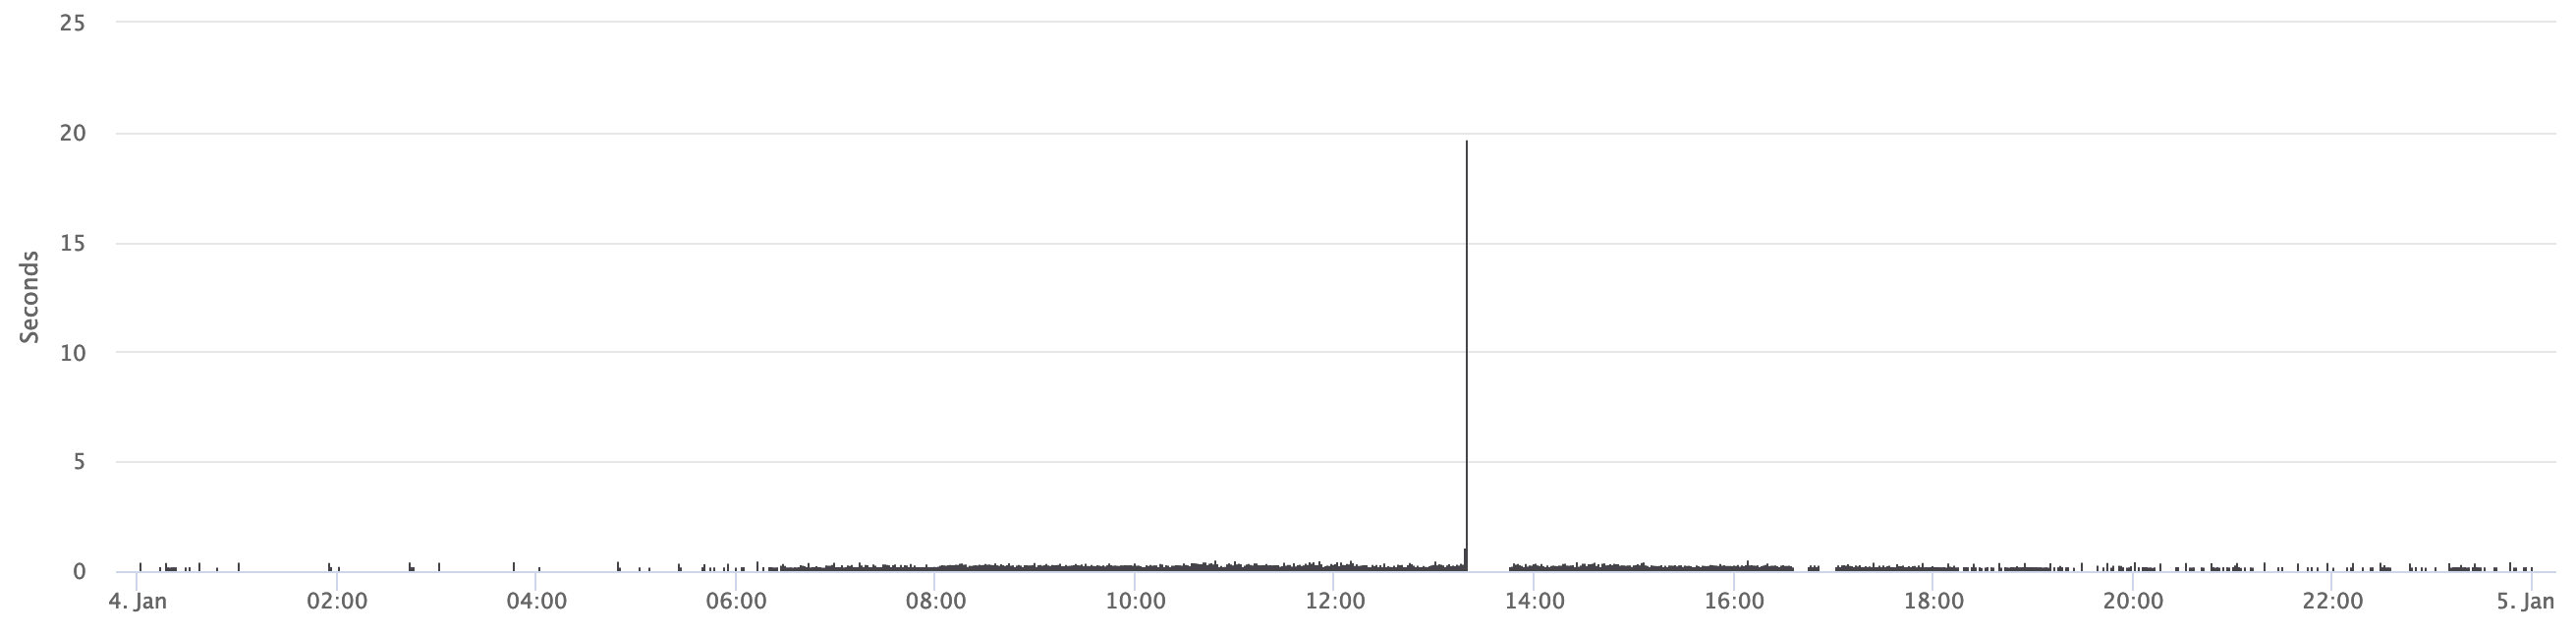
From the more detailed file analysis, i read:
- around 13:18:50, the response time of jira increased from to 2s, ... 8s.
- starting at 13:31:39, there are may 503 results from the jira, taking around 8 seconds.
- then (e.g. at 13:31:42, or 13:31:46), there are often 50 or more requests per second where some of these were very fast (<20ms) jira requests resulting in 503 from jira
- between 13:19:40 and 13:44:37, there were no HTTP client requests answered by jira with 200.
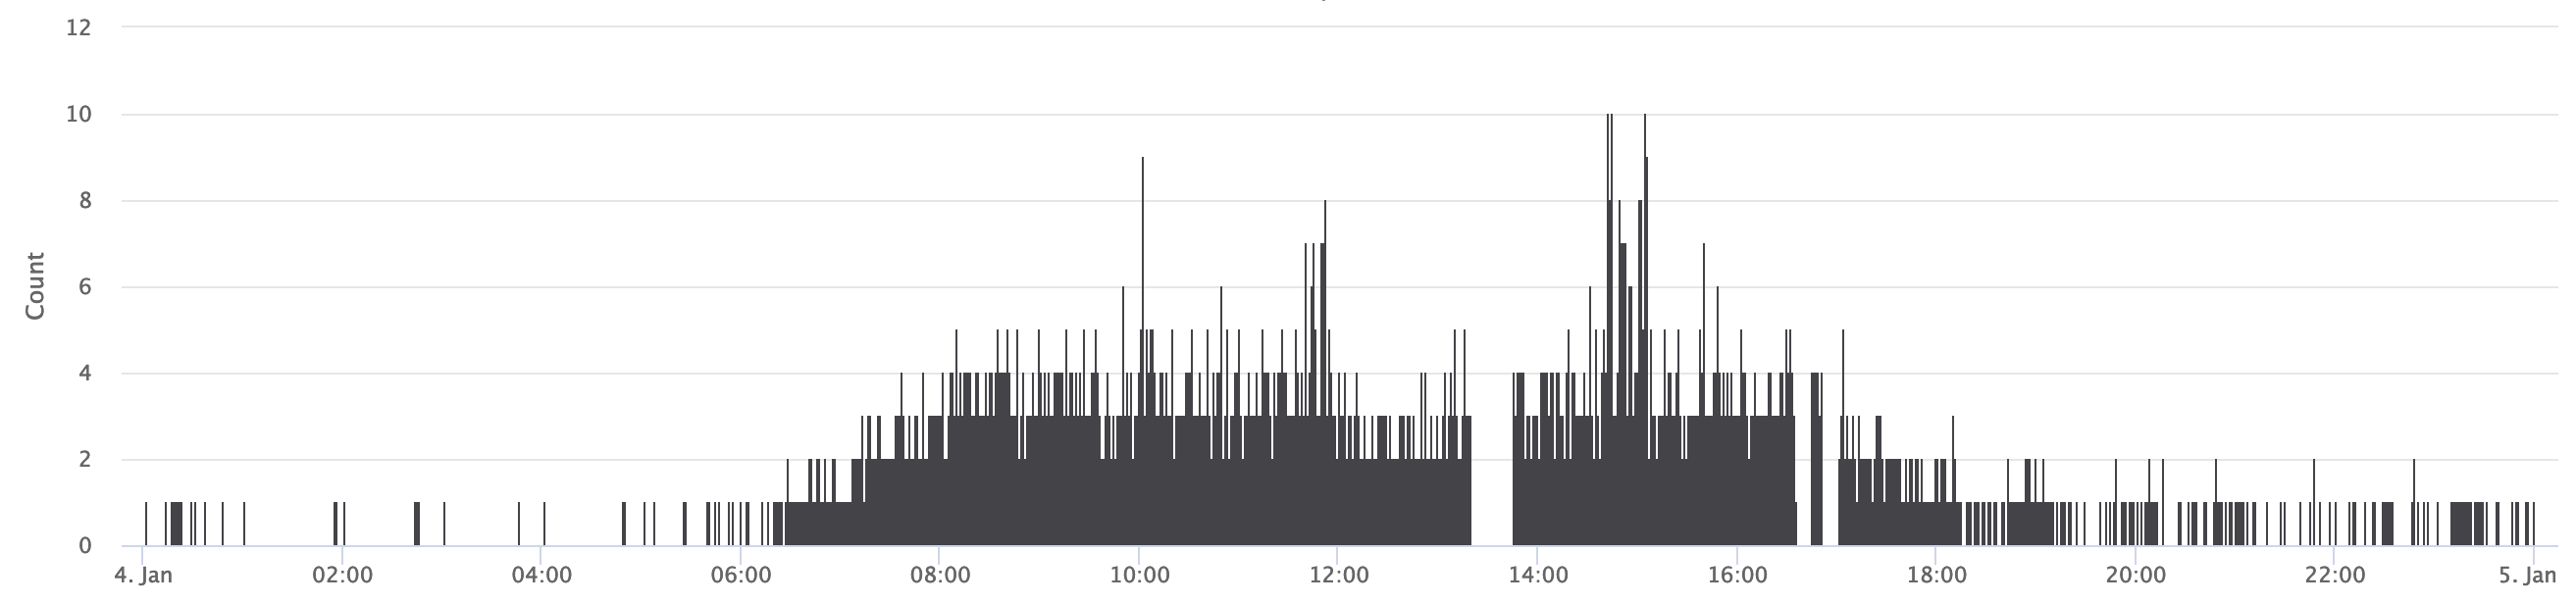
- also, when looking only at the successful requests, the runtime of these requests went up to 20s. (13:19:14: 19.6s, 13:19:40: 13s)
- The requests ending in 408 are distributed over the full day, but normally, these take ~500ms (the specified -expire time).
- Between 13:18:59 and 13:31:26, the reported timeout times are often substantially large (5s, 18s, up to 391s), although "-expire 500ms" was used.
So, one should probably concentrate first on figuring out, why the "-expire 500ms" flag was not honored in the successful requests, since this should be easier than trying to understand what happens with the timeout cases.
Do you have any information, what was the case with the jira system in this time window (hanging, overloaded, crashed)?
Talks NaviServer directly with jira, or is there a server between (e.g. a reverse proxy, or a load balancer).
What was the time window, when NaviServer hast stopped serving requests? Did it recover by itself, or did you restart it?
Yes, everything you have said is what we are experiencing and it looks like the data is showing that too.
Yes, focusing on -expire 500ms would be a good place to start - to see why it is not honored in these cases.
As for the last three questions you asked:
Do you have any information, what was the case with the jira system in this time window (hanging, overloaded, crashed)?
Answer: The Jira system was hanging and/or overloaded during the time frames above.
Talks NaviServer directly with jira, or is there a server between (e.g. a reverse proxy, or a load balancer).
Answer: We are talking directly to JIRA -- there is no proxy and no load balancer involved.
What was the time window, when NaviServer hast stopped serving requests? Did it recover by itself, or did you restart it?
Answer: We never did restart naviserver on Jan 4th - it recovered by it's self after JIRA was restarted.
Answer: Naviserver was un-responsive starting at 13:24pm - 13:31pm. Then we started to getting connections again at 13:32pm.
a) the requests were served by the "default" connection pool, and
b) the slow requests caused a backlog (where queued), but it took a while until these were served again.
Here are suggestions how to proceed:
- The first measure to improve the situation is to remove the potential queuing in the default connection pool. The simplest thing is to create a connection pool "slow". When using a recent version of the request monitor (not more than 2 years old), and a "slow" pool exists, these requests are automatically moved to this connection pool. This has the advantage, that other requests are still served as usually, even when there is queuing in the "slow" pool. See for an example of t "slow" pool in [1], but don't forget to remove the comment character in the line defining this pool.
- As a second measure, I would recommend installing the NaviServer munin plugins, since these will provide among other things monitoring of the queuing times per pool.
- Third measure: get the tip version from NaviServer from Bitbucket. I have today fixed a problem of clearing the timeout status codes (which must have been in the code since quite a long time). I do not see the direct connection to reported symptoms, but I cannot exclude, that it might be related.
- Fourth measure: when compiling NaviServer, compile it with debugging enabled "using the -g flag" and make yourself familiar how to attach GDB at runtime to nsd and how to dump the stacks of all threads in the running server [3]. In case, you see this symptom again, dump all stacks ("thread apply all bt") and mail to output to me.
How often have you experienced this problem?
Depending on your urge, I would recommend to start with the first two measures. These will also help you get more insights about the runtime behavior and potential bottlenecks on potential load peaks over the day.
Let me know what your new insights are.
all the best
-g
[1] https://bitbucket.org/naviserver/naviserver/src/f3b5ad7dcb956d0ee9251e914e20e3d585f1c7b4/openacs-config.tcl#lines-526
[2] https://github.com/gustafn/munin-plugins-ns
[3] https://stackoverflow.com/questions/18391808/how-do-i-get-the-backtrace-for-all-the-threads-in-gdb