
Forum OpenACS Development: Openacs.org: HTTP/3, the recent request storm, and better utilization diagnostics in action

Openacs.org has been running with HTTP/3 enabled for several weeks and is now on NaviServer 5.1.1. Alongside the protocol improvements, this work has brought better diagnostics for operating a busy OpenACS installation. Much of it was informed by investigating the unusually heavy traffic that openacs.org has experienced over the past weeks.
The traffic reached tens of millions of requests per day, with peaks of approximately 1,000 requests per second. The storm was spread across many different IP addresses, typically with only one or two requests per address. Forged User-Agent strings prevented reliable identification and routing of this traffic to dedicated bot pools. For example, the access log for August 24 contained more than 28 million requests and occupied about 15 GB. This creates pressure at several levels: accepting connections, performing TLS handshakes, processing requests, and storing logs.
Where the bottlenecks occurred
The previous configuration used a single HTTPS driver thread. During the storm, that thread reached 100% CPU utilization, with profiling showing more than 95% of its time spent inside OpenSSL during handshakes. The application threads could still have spare capacity while new clients struggled to establish connections.
We also observed packet drops in the host’s connection-tracking statistics and pressure on connection-tracking and listen-backlog limits. These were bottlenecks before requests reached NaviServer’s application queues. Slow connection establishment and timeouts compounded the pressure.
Raising the relevant limits and distributing HTTPS traffic across multiple driver threads made the site mostly usable again. However, strong bursts could still make connections difficult - even for administrators assigned to a separate connection pool. A dedicated application pool helps only after a request reaches it; it does not bypass a saturated network driver. We also identified overly aggressive request termination under the driver’s queue-overrun policy and improved the handling of these situations.
A separate consequence was the growth of the logs. Accumulated logs eventually filled the filesystem and prevented PostgreSQL from starting. Removing and compressing older logs restored space and service. This also prompted a review of retention: a policy that works under ordinary traffic can become expensive when each day adds many gigabytes.
The central lesson is that low overall CPU usage or an empty application queue does not establish that the system has sufficient capacity. A single driver thread, a networking limit, or disk space can become the limiting resource.
Making these limits visible
This experience helped shape the new Utilization page in nsstats, which requires NaviServer 5.1.1. It brings together operating-system limits, driver and networking limits, and request-processing limits per connection pool. The aim is to identify where pressure occurs before deciding which setting to change.
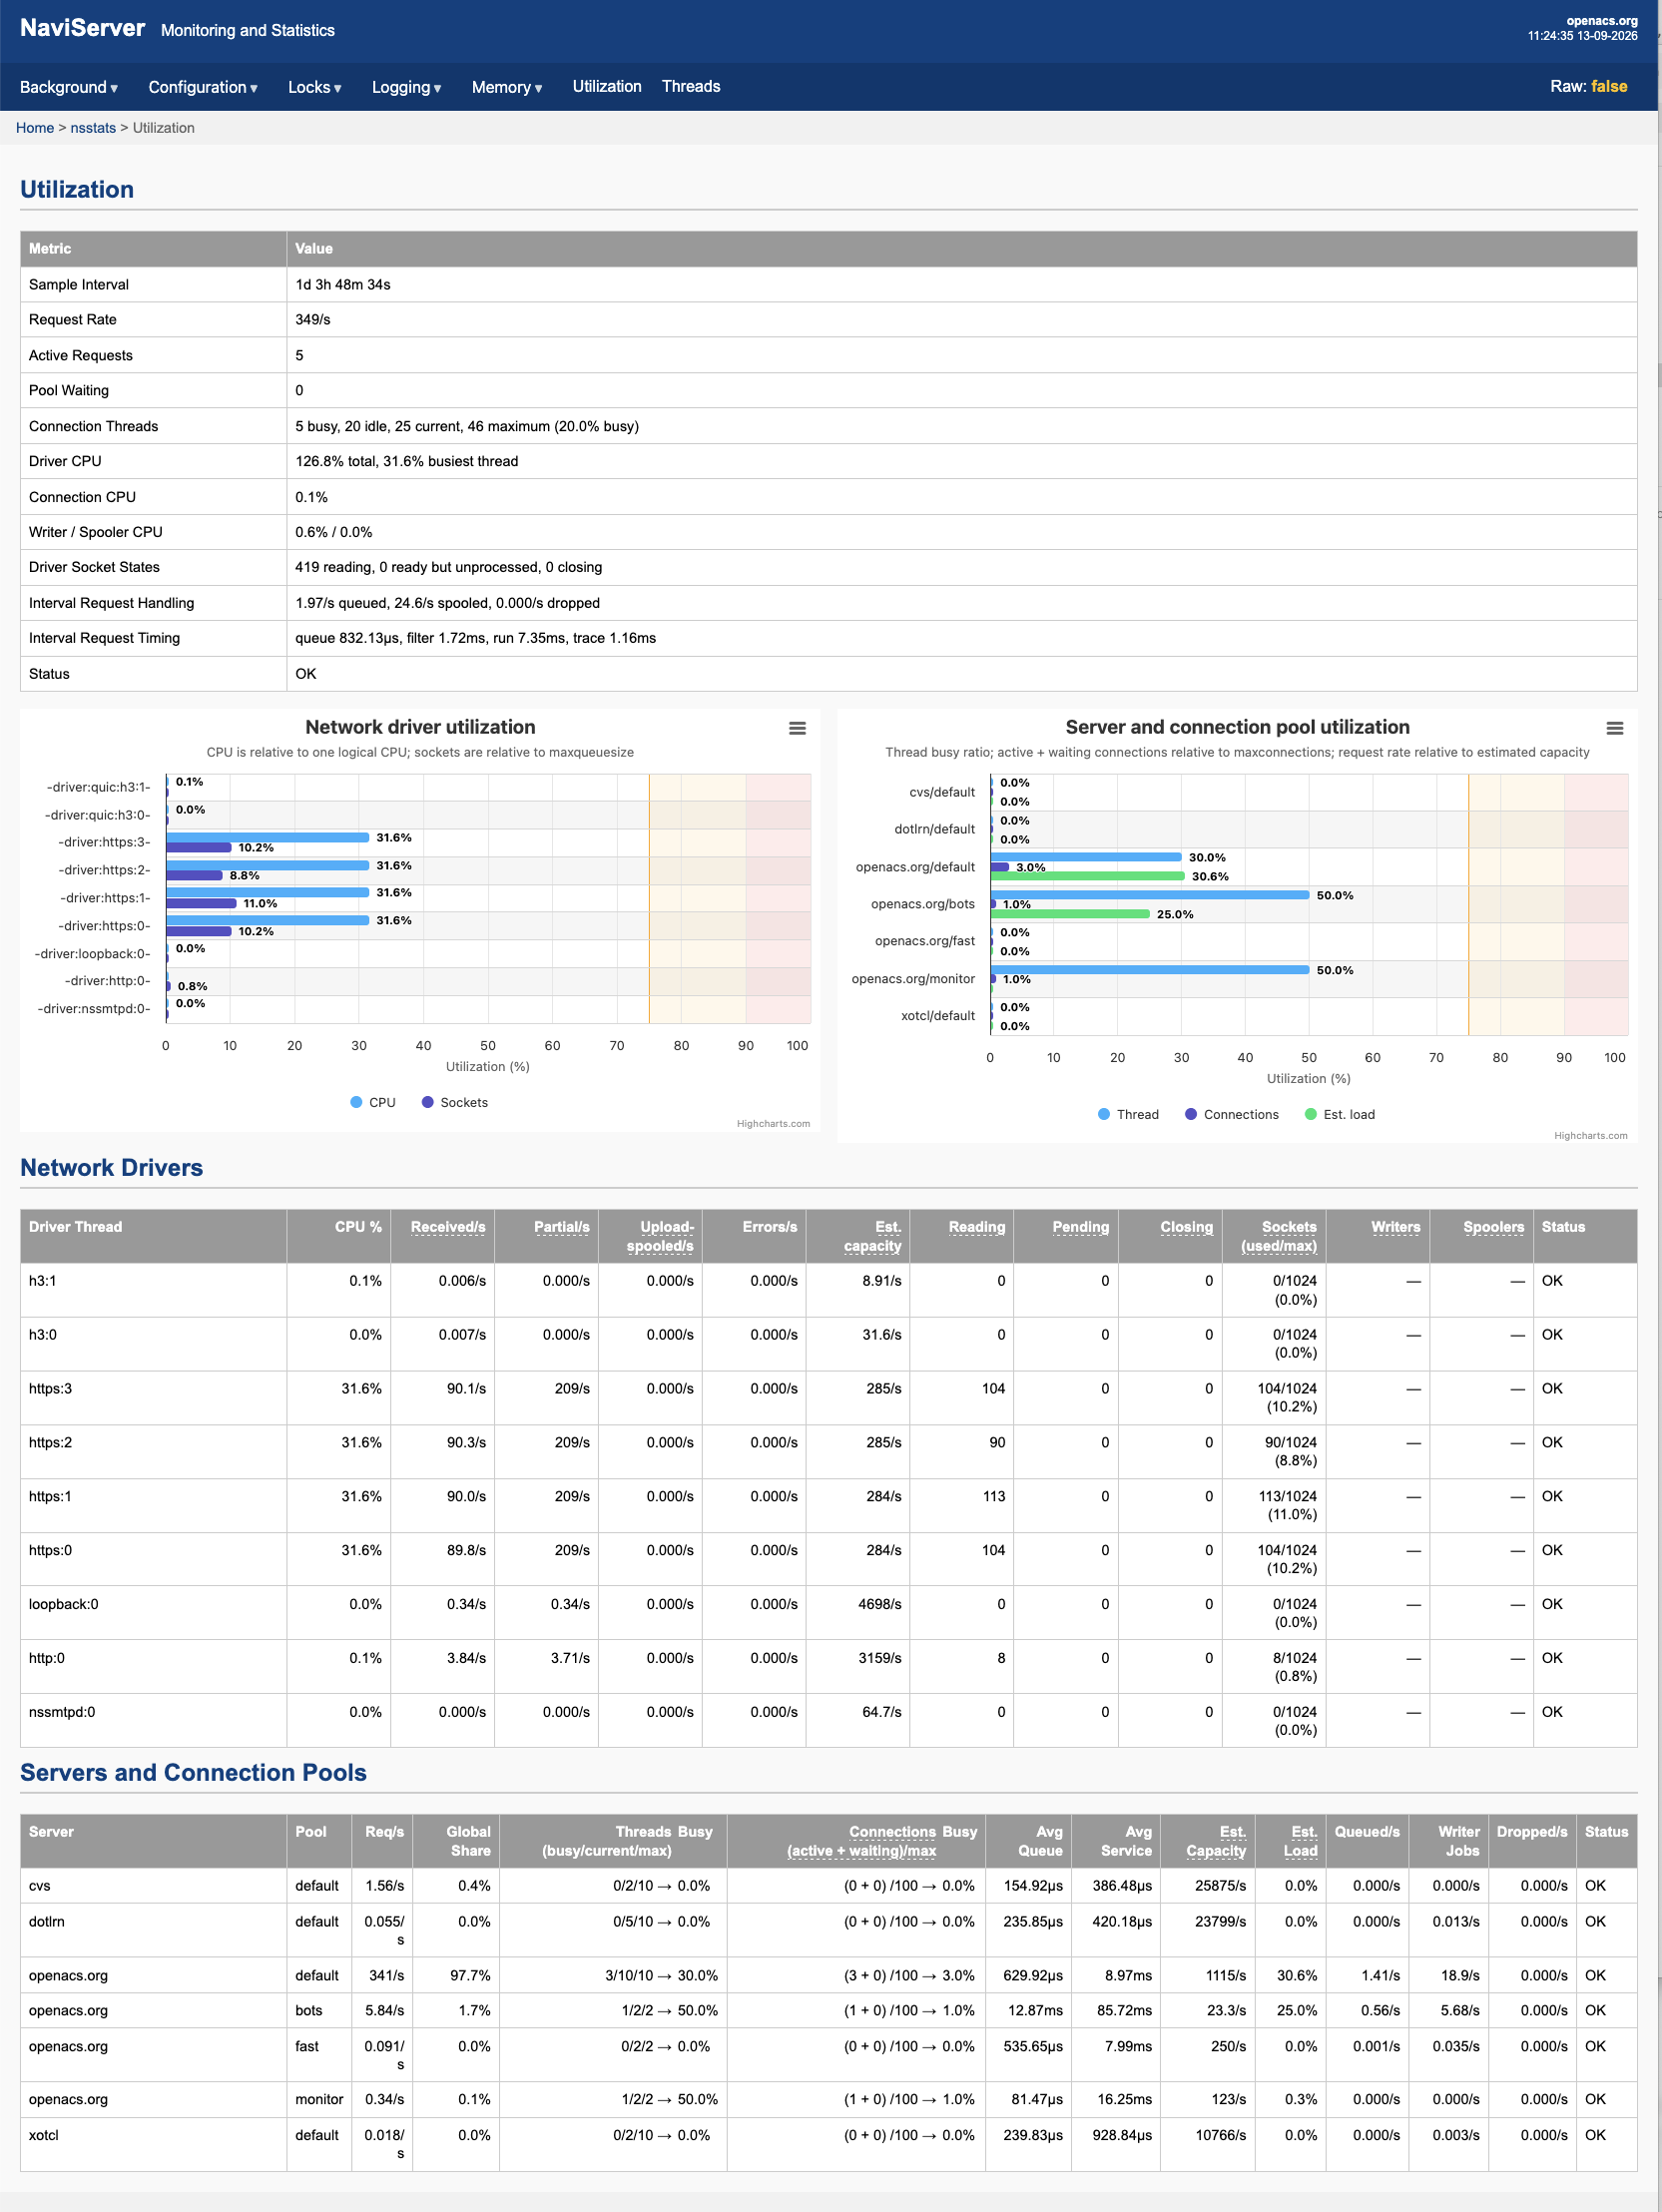
The screenshot above from September 13th shows a sample interval of approximately 27 hours and 48 minutes, with an average request rate of 349 requests per second. Here is what an administrator can learn from it:
- The HTTPS workload is distributed evenly. Each of the four HTTPS driver threads handles approximately 90 requests per second and consumes about 31.6% of one logical CPU. The combined driver CPU figure of 126.8% represents roughly 1.27 logical CPUs, not 126.8% of the entire machine. Looking at individual threads reveals bottlenecks that a machine-wide average can hide.
- Socket occupancy is separate from application concurrency. At capture time, 419 sockets are in the reading state, while only five requests are actively being processed. Each HTTPS driver uses roughly 9–11% of its configured socket capacity. Connections waiting for more input do not each occupy an application thread.
- The main application pool has room at the captured instant. The openacs.org default pool has three busy threads out of ten, with no requests waiting. Over the sample interval, it handles about 341 requests per second, with an average service time of roughly 9 ms and an average queue time of about 0.63 ms.
- Different request classes have different costs. The bots pool handles about 5.8 requests per second, but its average service time is approximately 85.7 ms and its average queue time is 12.9 ms. Looking only at request counts would obscure this difference. Separate pools allow these workloads to be observed and managed independently.
- A busy-thread percentage needs context. One busy thread in a two-thread pool produces a 50% busy reading. That is an instantaneous observation, not evidence that the pool was half occupied throughout the interval. Request rates, service times, and queue measurements provide the context needed to interpret it.
The page combines interval measurements with current state. Rates, CPU usage, and average timings describe the sampling period; thread counts and socket states show the situation when the page was captured. A long interval is useful for understanding sustained load, but shorter samples and logs are still needed to investigate brief peaks. We have seen temporary pool saturation even when the longer-term averages show substantial headroom.
The estimated-capacity figures are guidance for the observed workload, not measured maximum throughput. A change in request mix, database response time, or another shared resource can change the result.
More useful system logs
NaviServer 5.1.1 also improves the system log. Thread-replenishment messages identify the server, pool, and reason for creating a replacement. TLS errors include the requested SNI hostname. This revealed that nearly all of one large group of certificate alerts concerned retired domain names still present in old references. Consolidating related error information and removing misleading repetitions made these patterns easier to recognize while retaining useful diagnostic information.
Trying HTTP/3
The traffic in this screenshot is overwhelmingly conventional HTTPS over TCP, although HTTP/3 is enabled. These operational improvements are therefore useful independently of HTTP/3 adoption.
For installations that want HTTP/3, install-ns now supports building a selected OpenSSL version, for example by setting version_openssl=4.0.2. NaviServer’s HTTP/3 support requires OpenSSL 4.0.2 or newer together with nghttp3, which provides HTTP/3 framing and QPACK header compression. The installer also builds nghttp3 when selecting a supported OpenSSL 4.x version.
The updated Debian Trixie-based NaviServer and OpenACS images in my Docker Hub repositories were built using this option and are HTTP/3-ready. Deployment still needs the QUIC driver enabled and the corresponding UDP port exposed and forwarded.
The practical benefit of the new diagnostics is better evidence for operational decisions: whether to investigate the host, adjust networking limits, examine expensive requests, change pool capacity, or address growing log storage. The utilization page makes these situations easier to understand and manage.
All the best!
-gustaf neumann


