Forum OpenACS Development: NaviServer "breaks" under high load

Hi!

I've got a strange case here: A ]po[ server "breaks" (=hangs until a 'killall -9 nsd' restart) under high load (~60 "active users").

The last lines before the incident are:

[27/Jul/2018:17:30:09][56010.7f6a7206d700][-driver:nssock-] Notice: NsEnsureRunningConnectionThreads wantCreate 1 waiting 16 idle 0 current 74
[27/Jul/2018:17:30:11][56010.7f6a7206d700][-driver:nssock-] Notice: NsQueueConn wantCreate 1 waiting 17 idle 0 current 74
[27/Jul/2018:17:30:14][56010.7f6a7206d700][-driver:nssock-] Notice: NsQueueConn wantCreate 1 waiting 18 idle 0 current 75
[...]
[27/Jul/2018:17:30:35][56010.7f6a7206d700][-driver:nssock-] Notice: NsQueueConn wantCreate 1 waiting 34 idle 0 current 91
[27/Jul/2018:17:30:42][56010.7f6a7206d700][-driver:nssock-] Notice: NsQueueConn wantCreate 1 waiting 35 idle 0 current 92
[27/Jul/2018:17:30:46][56010.7f6a7206d700][-driver:nssock-] Notice: NsQueueConn wantCreate 1 waiting 36 idle 0 current 93
From what I can understand from the source code there are loads (36) threads "waiting". What could be the cause? Is the issue due to the maxconnections < maxthreads? Here is the relevant section of the config.tcl:
ns_param        maxconnections  100
ns_param        maxthreads      128
ns_param        minthreads      32
ns_param        connsperthread  1000
ns_param        highwatermark   80
I'll just increase the number of maxconnections and maxthreads for now.

Cheers
Frank

Collapse
Posted by Gustaf Neumann on
Hi Frank,

first of all, unless you are running the application on a raspberry pi, ~60 users is no load to be concerned of on a reasonable machine, we have servers with several thousand active users (clicking in a time window of 2 minutes). ... but users are not users, when these user fire e.g every second a request taking a minute, every server will run out of resources soon. So, in order to assess the situation of this server properly, more details are needed.

Concerning the configuration parameters:

  • maxconnections: having maxthreads higher than maxconnections never makes sense, NaviServer should warn you about this on startup
  • maxthreads: 128 is quite a large value! On the setup with 2000 concurrent users, we have in the default pool minthreads and maxthreads set to 25. Make sure to have enough db connections configured in your database setup. How many cores are available in this setup?
  • connsperthead: unless you have major data-leaks in the application, increase connsperthread to 10000; this is not relevant for the issue.
Common reasons for bad performance are:
  • database: You might run out of db-connections (threads will be hanging around idle waiting for db-connections) or simply to slow or to many queries.
  • slow clients: when NaviServer is not properly configured, the speed of client connections for uploads and downloads might cause long blocking connection threads. This will not happen, when spooler and writer threads are properly configured.
  • setup without multiple thread pools: In case, a site admin knows to have several very slow requests (taking each multiple seconds) the recommended setup is to have multiple thread pools, such that the slow requests are directed to special pools, but no other users are harmed.
How to check a site's characteristics? An easy way to get an overview is nstats module of NaviServer. One get from this module on the "Server" page among many other this the db-characteristics from the db-pools, like e.g.:

The avgwaittime is the average time for obtaining a db-handle, and avgsqltime is the average time of an SQL query.

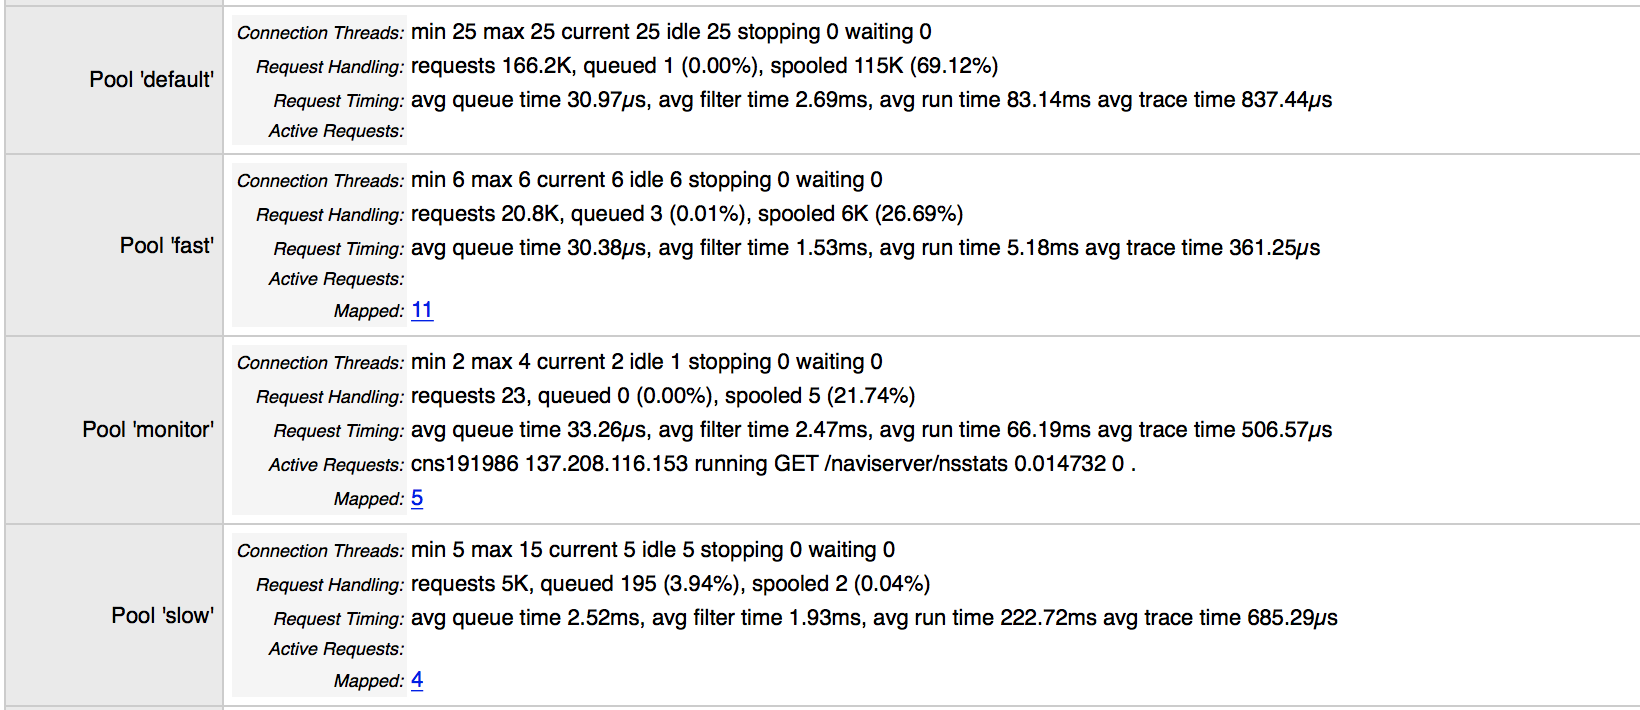
The same page provides as well information about the configured pools, like e.g. from the default connection thread pool:

When the queue time goes up, you should become alert. A high filter time is an indicator of permission problems, the avg runtime gives hints about the need of splitting connection pools.

Below, you see information about multiple connection pools, where e.g. the "monitor" pools is used on this site for monitoring applications (like munin) and for admins to adjust the setup at runtime when necessary (ds/shell, etc.)

Hope this helps!

Collapse
Posted by Frank Bergmann on
Thanks a lot Gustaf!

~60 users is no load to be concerned of

I've read about your impressive WU-Wien installation...

However, with ~2.500 "total users" (using ]po[ at least once a week for hour logging, as opposed to these ~60 "active users" in the 2 min interval), also the number of "activities" (projects, tickets and tasks) go up more or less linearly. Most pages algorithms with at least n*log(n) complexity, so that overall load rises with at least n^3*log(n) with the number of users, probably even higher.

maxconnections

Right, this didn't make sense...

maxthreads

OK. I've now set maxthreads = minthreads = 32 and highwatermark=100 in order to disable dynamic thread creation.
The server has 8 physical cores. The "hang" occurred during re-spawning threads if I understood it right. So maybe just disabling dynamic thread creation might fix the situation.

database connections

We've got 15, 5 and 5 for pools 1, 2 and 3 respectively.

I'll have a detailed look at DB-connection stats next Friday.

It seems "hangs" have occurred so far only Fridays, because users seem to log hours for the week on Friday. Logging hours initiates some complex cache maintenance PG-triggers: Logged hours will create "cost items" which are attached to the respective activity. These items are rolled-up (aggregated) the project-activity-hierarchy towards the main project as part of a cache for the most important financial figures per project.

Cheers!
Frank

Collapse
Posted by Frank Bergmann on
Hi Gustaf,

The server keeps on "hanging".

I've found that my customers has added "DB-queries in a loop" in the ]po[ page for timesheet logging. So this page now takes 3000ms instead of 90ms. So that explains a bit of the pain.

I it would be kind of OK if the server would be slow. However, this does not explain "hanging" to me.

=> Is it possible that the system hangs because of "recursive" queries/sub-queries?

nsstats

I've installed nsstats 1.7 on my server, but I don't see the "db-pools" option. And the "Process" option is giving me an error: "can't read stats(tracetime): no such element in array". Any idea how I can fix this? We're running:

Tag: tar-4.99.8
Built: Nov 19 2015 at 22:18:45
Tcl version: 8.5
Platform: linux

hopelessly overloaded

I have just noticed the server "hanging" without any activity, with one user on the system apart from myself. So "overload" is not the right term... 😊

Cheers
Frank

Collapse
Posted by Gustaf Neumann on
The urgency does not seem to be very high, since your reply was about 2 months after my prior response.

When you have such an old server (4.99.8 is 3.5 years old) it is likely that you have just a single connection thread pool. With queries in the range of 3 seconds and a single connection thread pool configured, it is easy to block this pool completely, leading to a queuing situation (which is in the user perception a "hang"). The feature of dynamic connection thread pool mapping was introduced with NaviServer 4.99.15 early last year (see e.g. [1]). With this one can map slow requests dynamically to an own pool, where such requests might pile up, but they don't block other traffic.

My recommendation is to update NaviServer to a recent version and use dynamic thread pool mapping. Concerning exceptions from nsstats: the NaviServer modules are released in concert with matching versions in the *modules* directories (see e.g. [2]). there is some tolerance in backward compatibility, but as it looks not so far.

In case, the mapping is not sufficient, and there are more configuration issues, the newer, more detailed statistics can bring more insights.

[1] https://www.mail-archive.com/naviserver-devel@lists.sourceforge.net/msg03446.html
[2] https://sourceforge.net/projects/naviserver/files/naviserver/4.99.16/

Collapse
Posted by Frank Bergmann on
Hi Gustaf,

urgency

My last set of changes seemed to have worked, but the problems re-surfaced.

nsstats.tcl

Do I have any other option in order to get statistics on the DB-pools?

Yesterday I have increased DB-connections:

In the config.tcl (8 physical cores):

maxconnections 200
maxthreads 32
minthreads 32
connsperthread 10000
highwatermark 100

Pool1:
connections 200

Pool2:
connections 20

Pool3:
connections 20

So again, the server seems to be running fine today.

Thanks for you help!
Frank

Collapse
Posted by Gustaf Neumann on
some feedback to suggestions is anticipated.

other option in order to get statistics on the DB-pools?

according to the NEWS file of NaviServer "ns_db stats" was introduced in NaviServer 4.99.9 (jan 2016)

Collapse
Posted by Gustaf Neumann on

as a reference, we haven on learn@wu on the year average ~10k different users per day.

The "hang" occurred during re-spawning threads

Probably the server was not "hanging", but just hopelessly overloaded; if there is a single connection pool in use, a fresh request has to wait, until all waiting jobs are processed. In such situations, many users press eagerly reload, worsening the situation even more, and nobody sees finishing pages; even worse, with a single connection pool, even formerly fast requests (also static files) have to wait for the slow requests - so multiple connection pools are highly recommended for sites with high load and slow requests. The message in the error log said that the server would like to create more threads, but it was already at max.

You will need more db-connections: when using OpenACS most likely every active connection thread will require at least one DB connection, same is true for background processing. So, with 32 connection threads, you would need 32+ db connections for pool1...

Collapse
Posted by Frank Bergmann on
just hopelessly overloaded

Nope! I had top and atop running exactly at that moment, and the load was pretty normal (some 150% CPU, out of 800% available), and atop didn't show too many I/O operations neither.

reload

There was also no noticeable slow-down of the server in the 30-60 seconds before the "hang". I was monitoring performance using your excellent /request-monitor/...

db-connections

Done.

I'll let you know how things are going next Friday!

Thanks a lot!
Frank

Collapse
Posted by Gustaf Neumann on
a server is also overloaded, when it is permanently waiting for resources..... e.g. waiting for db-connections.